Bank Customer Churn Analysis | Case Study
__________________________________________________________________________________________________________________________________________Project Overview
This project analyzes customer churn for a commercial bank to identify high-risk customers, uncover key drivers of attrition, and recommend targeted retention strategies.The analysis follows an end-to-end data analytics workflow, starting from raw data ingestion and cleaning, exploratory data analysis, and ending with interactive Power BI dashboards designed for executives and business stakeholders.
The final output consists of three dashboards:
- Executive Overview
- Risk Segmentation
- Retention Action & Intervention
Business Problem
The bank is experiencing a significant customer churn rate (~20%), leading to:
- Loss of recurring revenue
- High-value customers leaving without early warning
- Inefficient, untargeted retention campaigns
The bank lacks visibility into:
- Which customer segments are most likely to churn?
- How churn varies by geography, age, balance, credit score, and tenure?
- Which customers should be prioritized for immediate retention actions?
Business Goal
The primary goals of this project were to:
- Quantify overall churn and financial risk
- Identify high-risk customer segments and churn drivers
- Estimate revenue at risk due to churn
- Enable proactive, targeted retention strategies
- Provide executives with clear, actionable insights through dashboards
- Data Ingestion & Cleaning (Python)
- Handled missing values and inconsistencies
- Created derived features (age groups, balance ranges, tenure groups, credit score bands)
- Ensured data quality for downstream analysis
- Exploratory Data Analysis (SQL)
- Calculated churn rates across multiple dimensions
- Analyzed relationships between churn and customer behavior
- Identified early patterns and risk indicators
- Visualization & Storytelling (Power BI)
- Built interactive dashboards with filters
- Designed executive-friendly KPIs
- Translated analysis into actionable insights
Data Workflow
- Python: Pandas, Numpy, Matplotlib, Seaborn
- SQL: Exploratory data analysis and metric calculations
- Power BI: Calculated fields, Data modeling, DAX measures, dashboard design
- Excel/CSV: Data storage and validation
Skills Used
Dashboard 1:
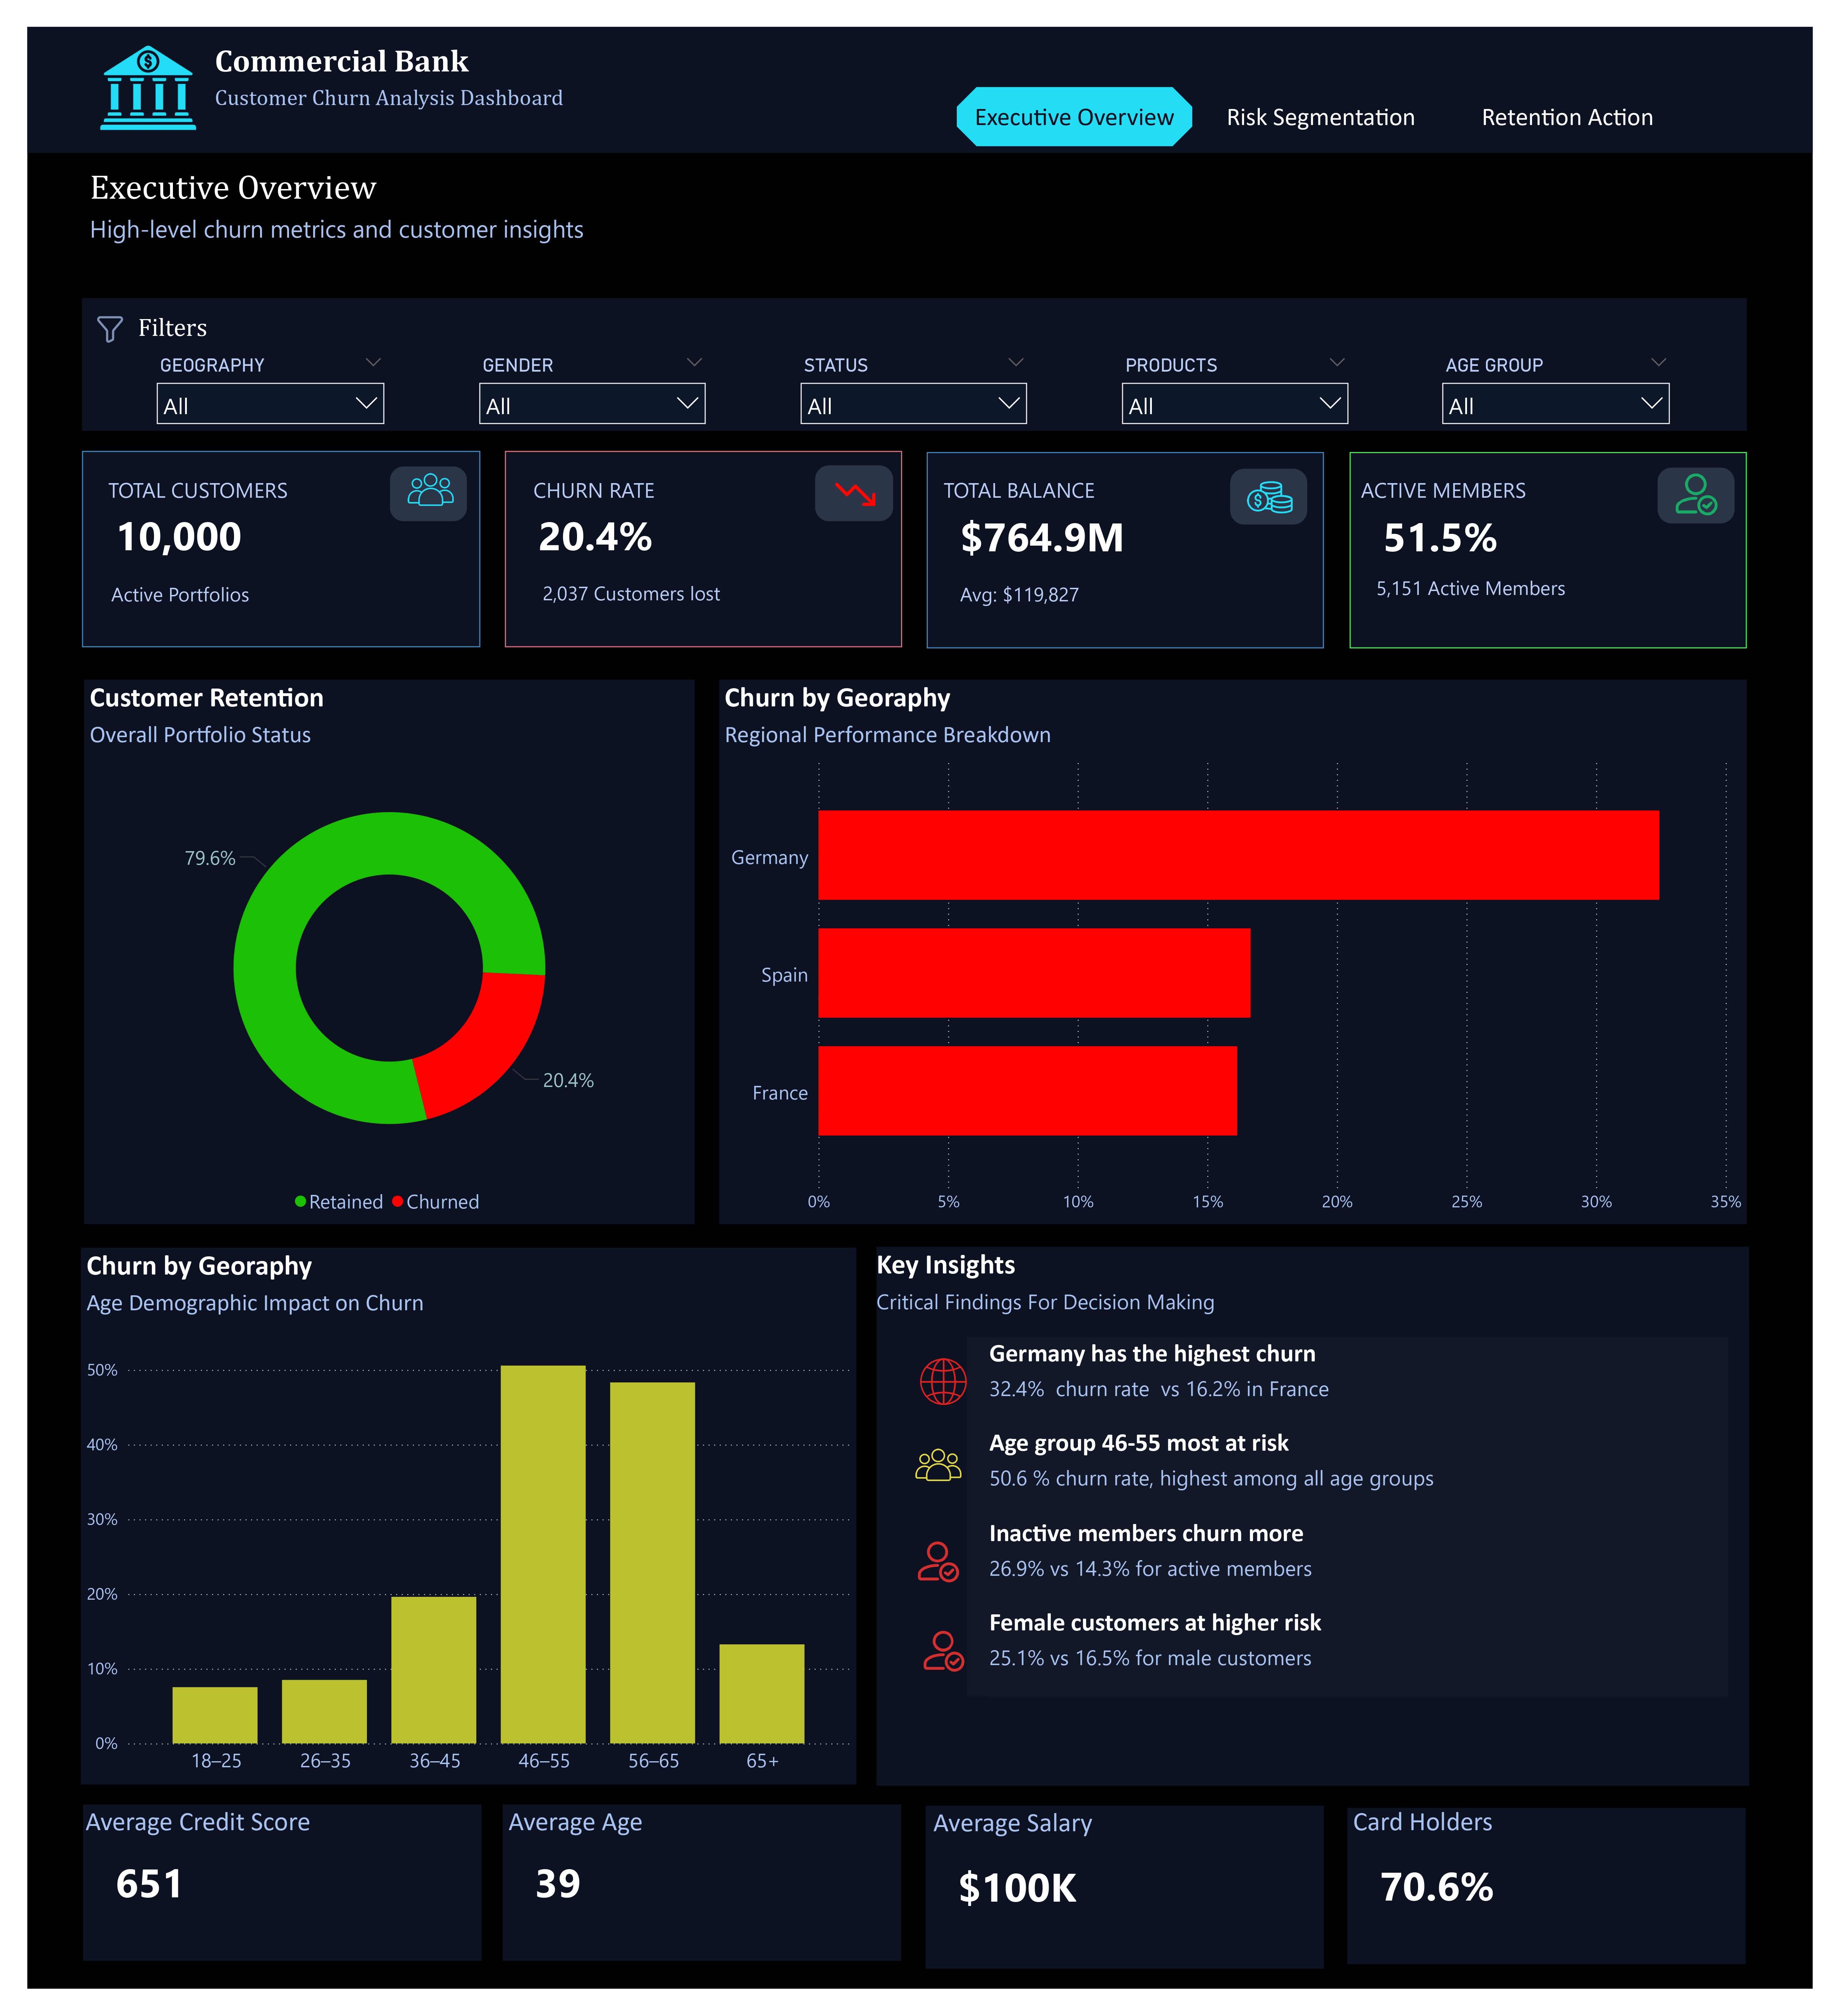
Key Insights
- Overall churn rate is 20.4%, representing 2,037 customers lost
- Germany has the highest churn rate (32.4%), significantly above France and Spain
- Customers aged 46–55 show the highest churn risk (50.6%)
- Inactive members churn almost 2× more than active members
- Female customers show higher churn than male customers
- Over $764.9M in total balance is exposed, with $206.7M potential revenue impact
Recommendations
- Prioritize churn reduction initiatives in the German market
- Launch reactivation campaigns for inactive customers
- Develop age-specific retention programs for customers aged 46–55
- Improve engagement strategies for customers before they become inactive
Dashboard 2:
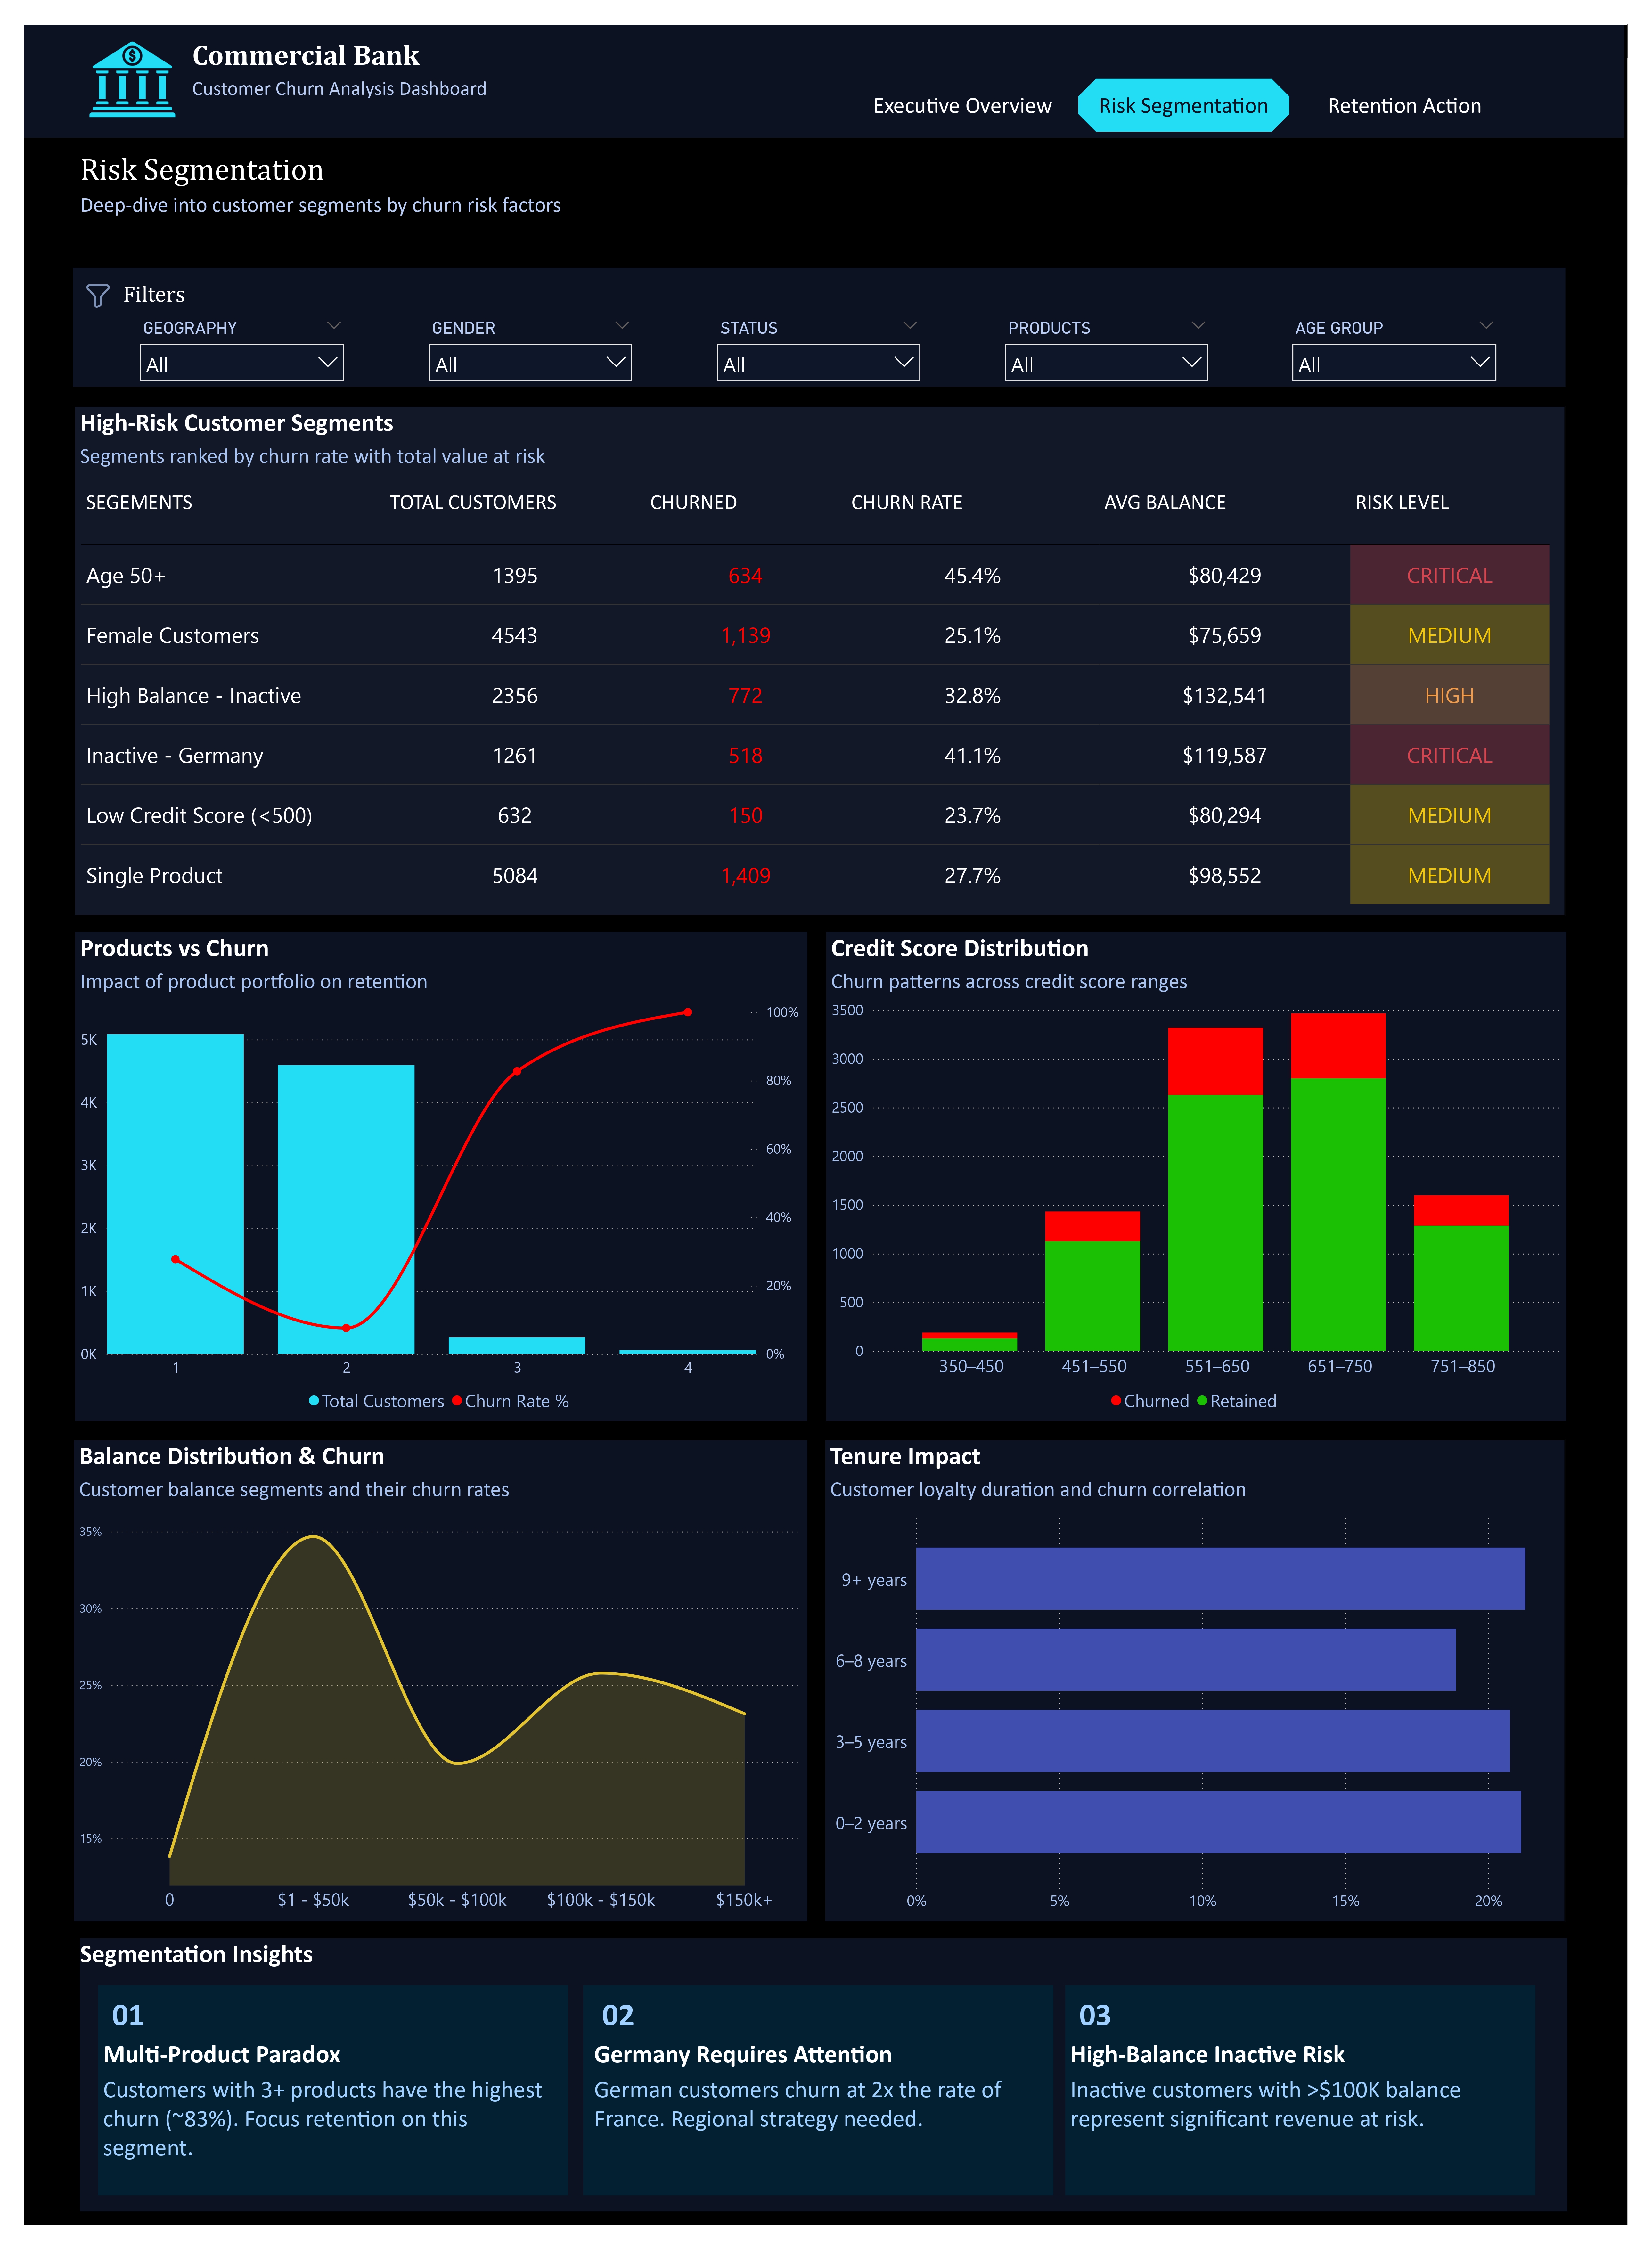
Key Insights
- Age 50+ customers have a churn rate of 45.4% (Critical Risk)
- High-balance inactive customers represent large financial exposure despite smaller volumes
- Customers with low credit scores (less than 500) show consistently higher churn
- Single-product customers churn more than multi-product customers
- Balance distribution shows churn peaking in low-balance and very high-balance segments
- Short-tenure customers (0–2 years) are more vulnerable to churn
Recommendations
- Introduce loyalty incentives for high-balance inactive customers
- Upsell single-product customers to multi-product bundles
- Implement early engagement programs during the first 2 years
- Monitor low-credit-score customers more closely with proactive offers
🔹 Dashboard 3:
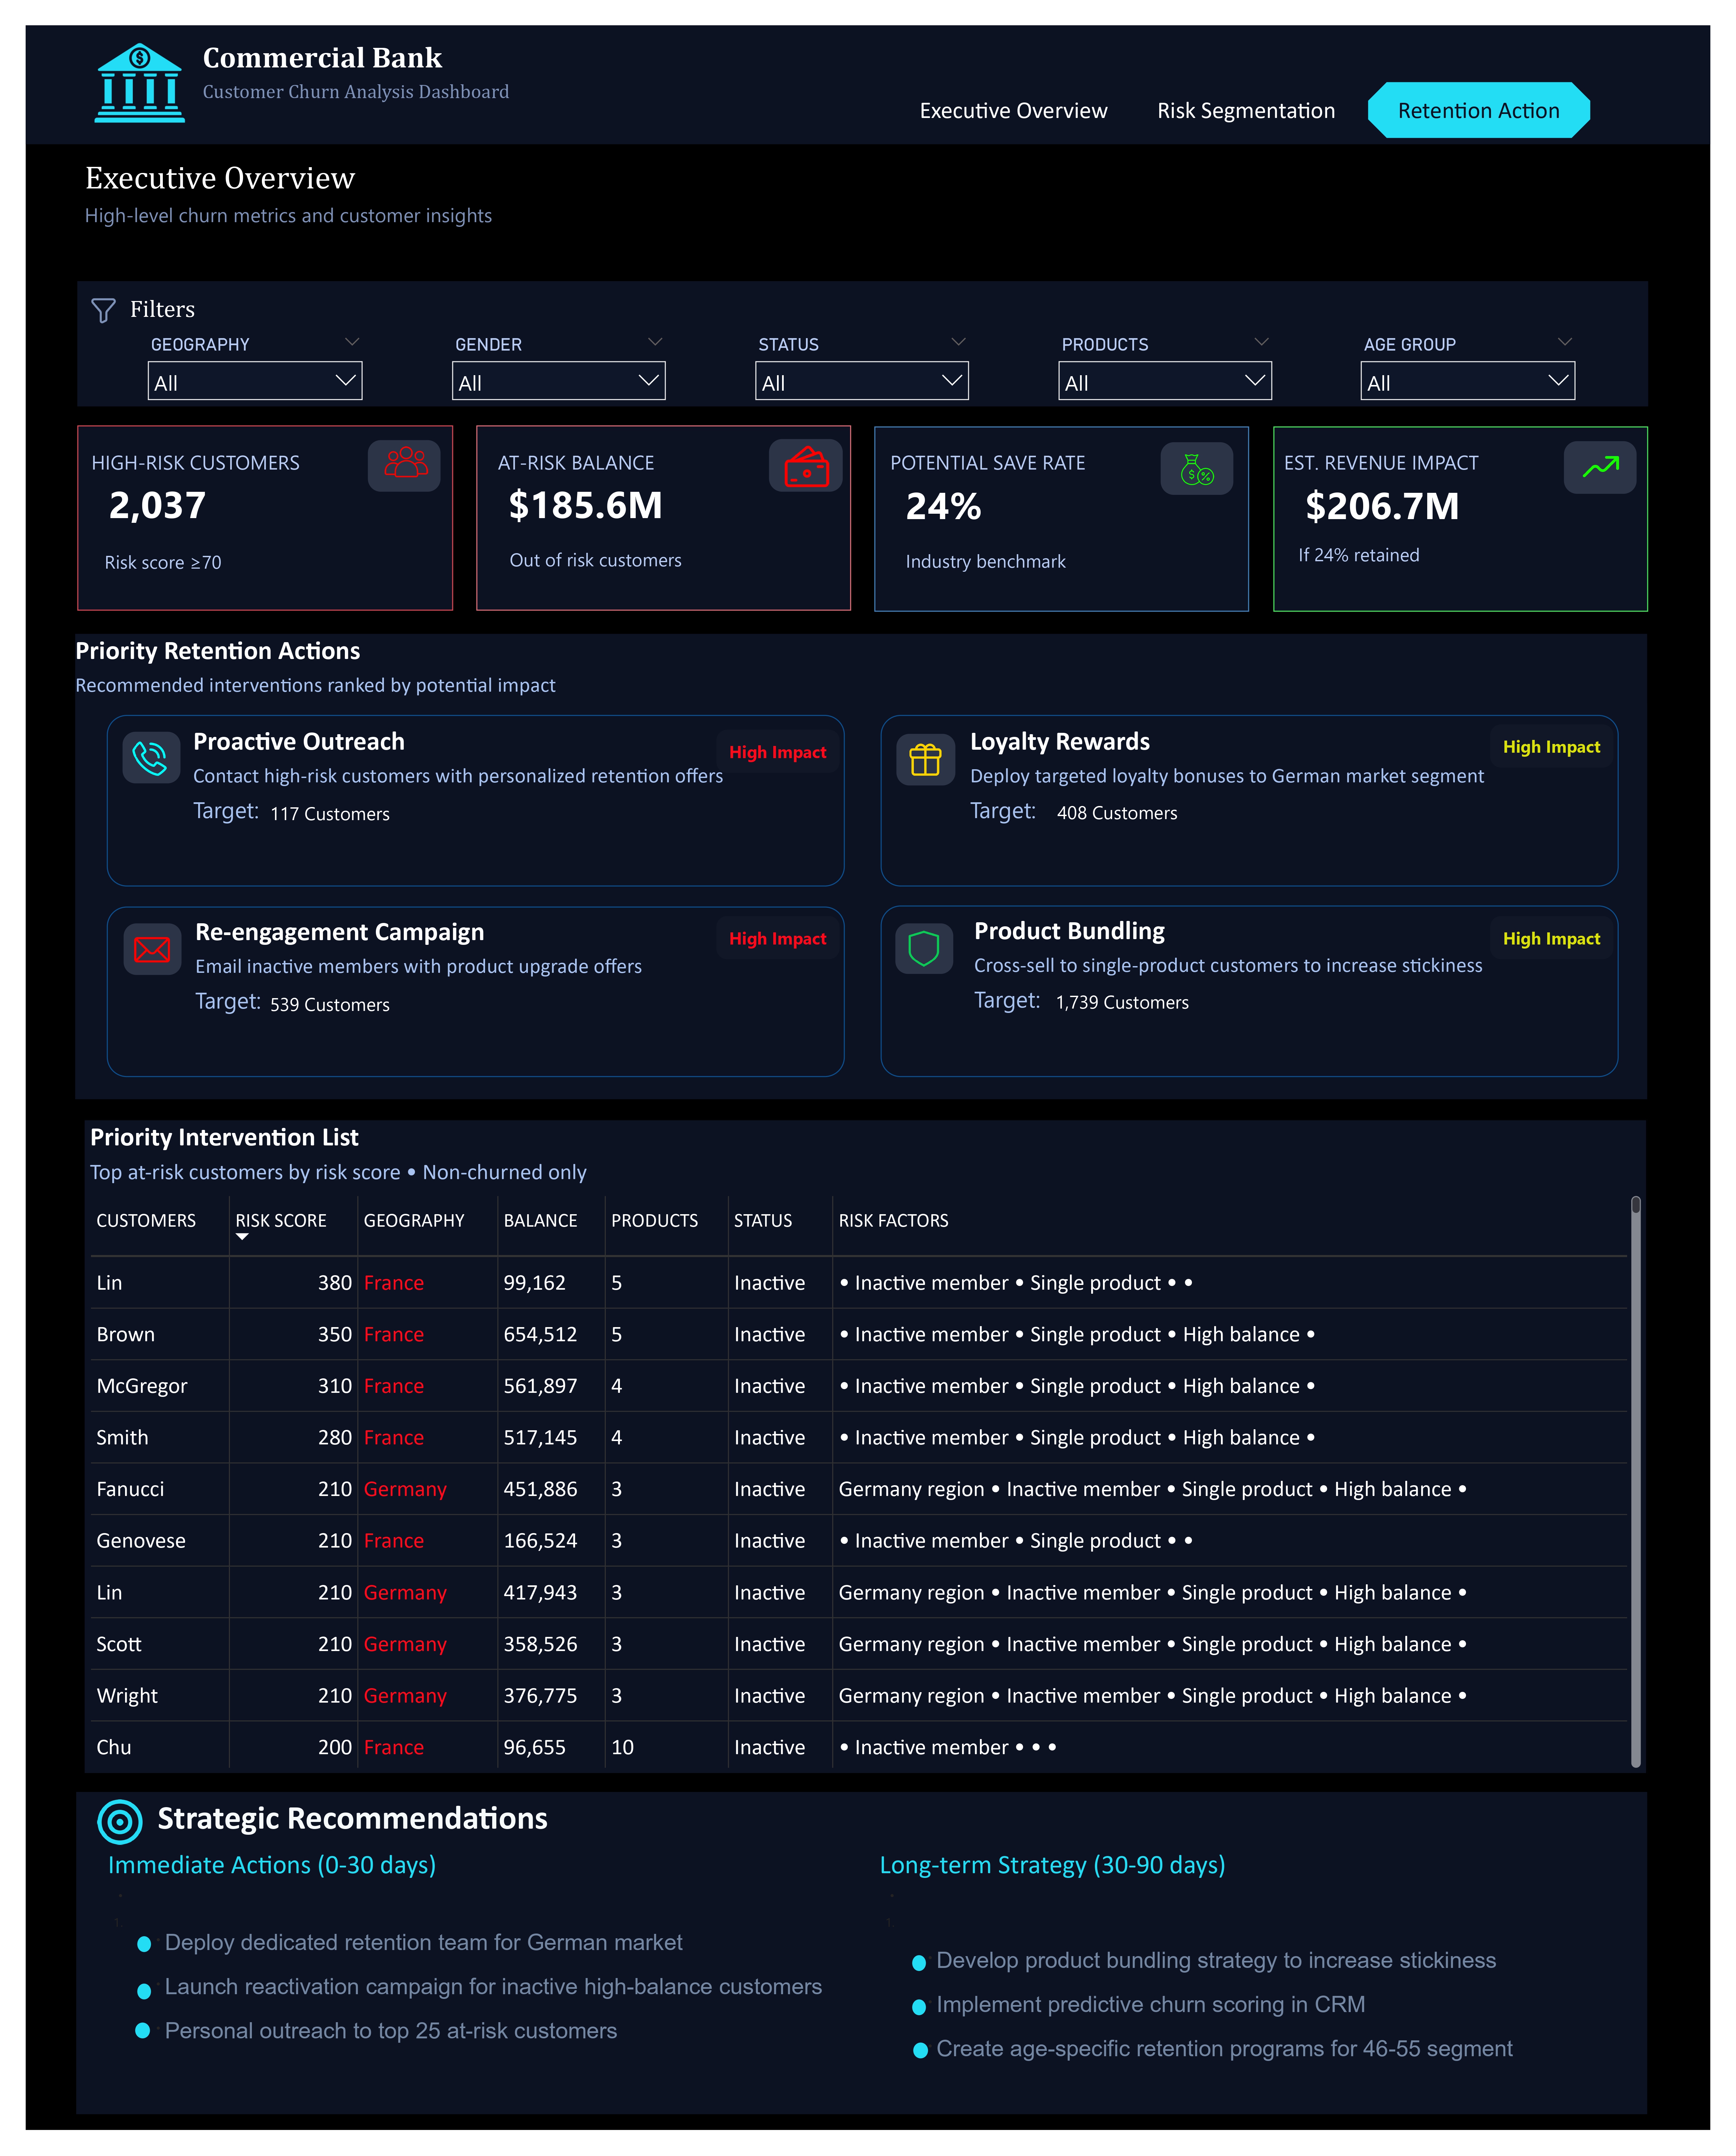
Key Insights
- 2,037 customers classified as high-risk (risk score ≥70)
- $185.6M in balance currently at risk
- Estimated 24% potential save rate, aligned with industry benchmarks
- Top churn risk drivers include:
- Inactivity
- High balance
- Single product ownership
- Germany Region
- A small group of customers represents disproportionately high revenue risk
Recommendations
- Proactive outreach to top 25 highest-risk customers
- Deploy dedicated retention teams for Germany
- Re-engagement campaigns targeting inactive high-balance customers
Immediate Actions (0–30 days):
- Implement predictive churn scoring in CRM systems
- Expand product bundling to increase customer stickiness
- Design personalized retention programs by age group and tenure
Long-Term Strategy (30–90 days):
Next Steps
- Build a Churn Prediction Model (Logistic Regression / XGBoost).
- Automate dashboards with monthly refreshes from the bank’s CRM.
- Combine with CSAT/NPS data for a 360° customer view.
- Deploy predictive alerts for high-risk customers via email or app notifications.