College Exam Result Analysis | Case Study
_________________________________________________________________________________________________________________________________________Project Overview
This project involved architecting a scalable data solution for an educational institution to monitor student success and operational health. I transformed a fragmented dataset of 3,000+ student records into an automated "Pro Max" dashboard. By building a custom ETL pipeline and a robust data model, I enabled the institution to move from manual spreadsheets to a centralized system that identifies at-risk students and high-performers in real-time.Business Problem
The institution faced significant "Data Friction." Student records were inconsistent, with academic years stored in formats (e.g., "2023/2024") that made filtering and indexing nearly impossible. This led to:- Identification Lag: Faculty could not easily identify students falling below attendance thresholds.
- Non-Unique Identifiers: Lack of distinct Student IDs made it difficult to link scores to individual demographics.
- Manual Overload: Staff spent hours every week cleaning data instead of analyzing it.
Business Goal
- Standardize Data Architecture: Split and normalize academic years and create unique Student IDs for every record.
- Visualize Critical KPIs: Provide instant visibility into Total Enrollment, Pass Rates, and Average Scores.
- Identify Behavioral Trends: Correlate study habits and attendance with final academic outcomes.
- Automate Reporting: Build a "set-and-forget" pipeline where new data (2025+) integrates seamlessly without manual intervention.
Data Workflow
- Automated ETL: Used Power Query to clean 3,000+ records, transforming inconsistent year strings into numeric formats and implementing a "Late-Typing" strategy to prevent data-type errors.
- Unique Indexing: Engineered a custom Primary Key system to generate unique student_id identifiers, ensuring data integrity across multiple academic years.
- Performance Logic: Authored DAX measures to segment student data, specifically flagging "At-Risk" students (Attendance below 70\%) and "High Performers" based on study-hour correlations.
- Executive Delivery: Built three high-resolution, interactive dashboard utilizing Custom Format Strings to display professional KPIs without breaking the model's underlying numeric logic.
Technologies Used
- Power BI: Data Modeling, Advanced DAX, and Interactive Visualization.
- Power Query (M): Advanced ETL, Column Splitting, and Data Normalization.
- SQL : Used for initial data profiling and validation of the raw 3,000+ records
_________________________________________________________________________________________________________________________________________Dashboard 1: Performance Overview
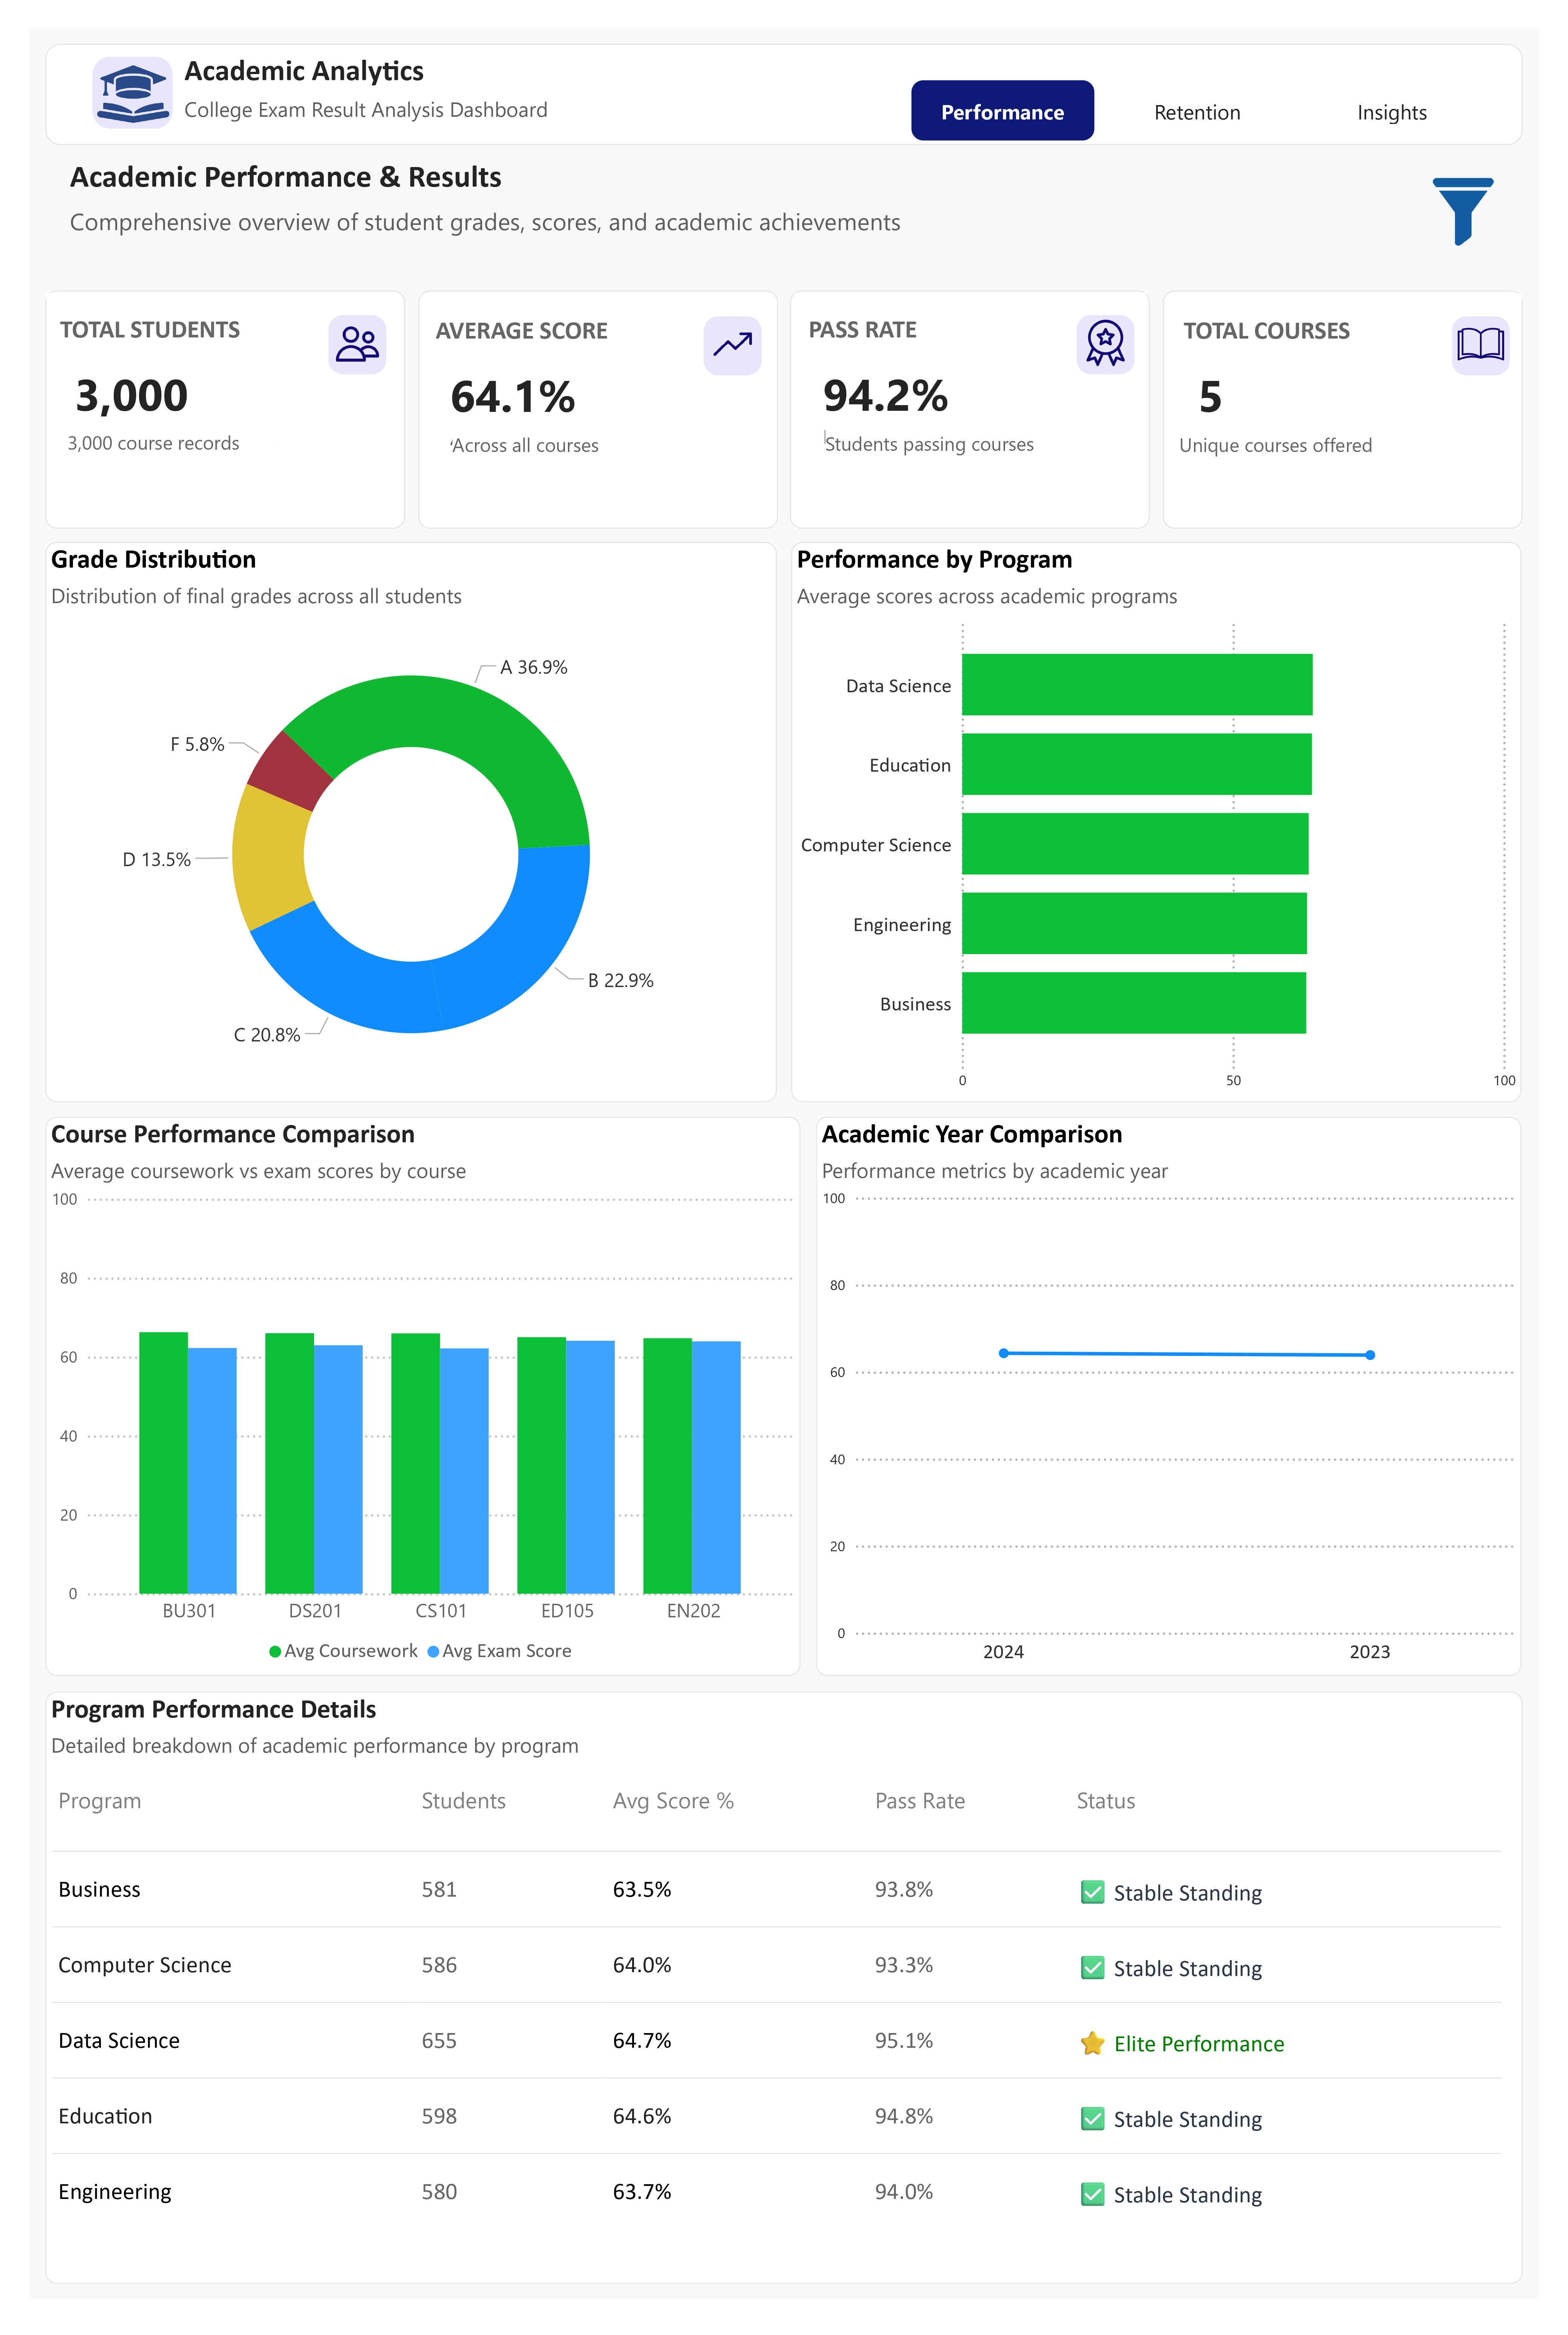
Key Insights
- Overall Academic Health Is Strong, But Not Excellent:
- Pass rate: 94.2% → institution is doing well at getting students through.
- Average score: 64.1% → this is mid-range, not high-performing.
- Translation: students are passing, but many are barely clearing the bar.
- Grade Distribution Shows a Performance Ceiling:
- A & B grades ≈ 60% combined, which is solid.
- C & D grades ≈ 34% — that’s a big chunk sitting in the “vulnerable” zone.
- F at 5.8% may look small, but at 3,000 students, that’s ~174 failures.
- Programs Perform Similarly — No Clear Standout Except One:
- Most programs cluster tightly around 63–65% average score.
- Data Science leads slightly (64.7%) and is flagged as Elite Performance.
- This suggests: Standardized grading rigor Or lack of program-specific academic innovation
- Coursework Beats Exams Across All Courses:
- In every course, coursework scores more than exam scores.
- Indicates: Exams are more difficult Or students rely too much on continuous assessment
- Risk: exam-heavy semesters could spike failures.
- Year-on-Year Performance Is Flat:
- 2023 vs 2024 average scores are almost identical.
- No visible academic growth over time → stagnation risk.
Recommendations
- Shift Focus From Passing to Excellence:
- Set a strategic KPI: Increase average score from 64% → 70%.
- Reward departments that push B → A conversions.
- Target the “C-Grade Majority”:
- Introduce tutoring or revision bootcamps for students scoring 55–65%.
- This group is the easiest to uplift with minimal resources.
- Audit Exam Difficulty & Alignment:
- Review whether exams truly reflect coursework objectives.
- Consider:Better exam prep, Mock exams, Exam skills workshops, Exam skills workshops
- Replicate Data Science Best Practices:
- Identify what Data Science is doing differently: Teaching methods?, Assessment mix?,Exam skills workshops,Student engagement?
- Roll that model into other programs.
_________________________________________________________________________________________________________________________________________Dashboard 2: Retention Dashboard
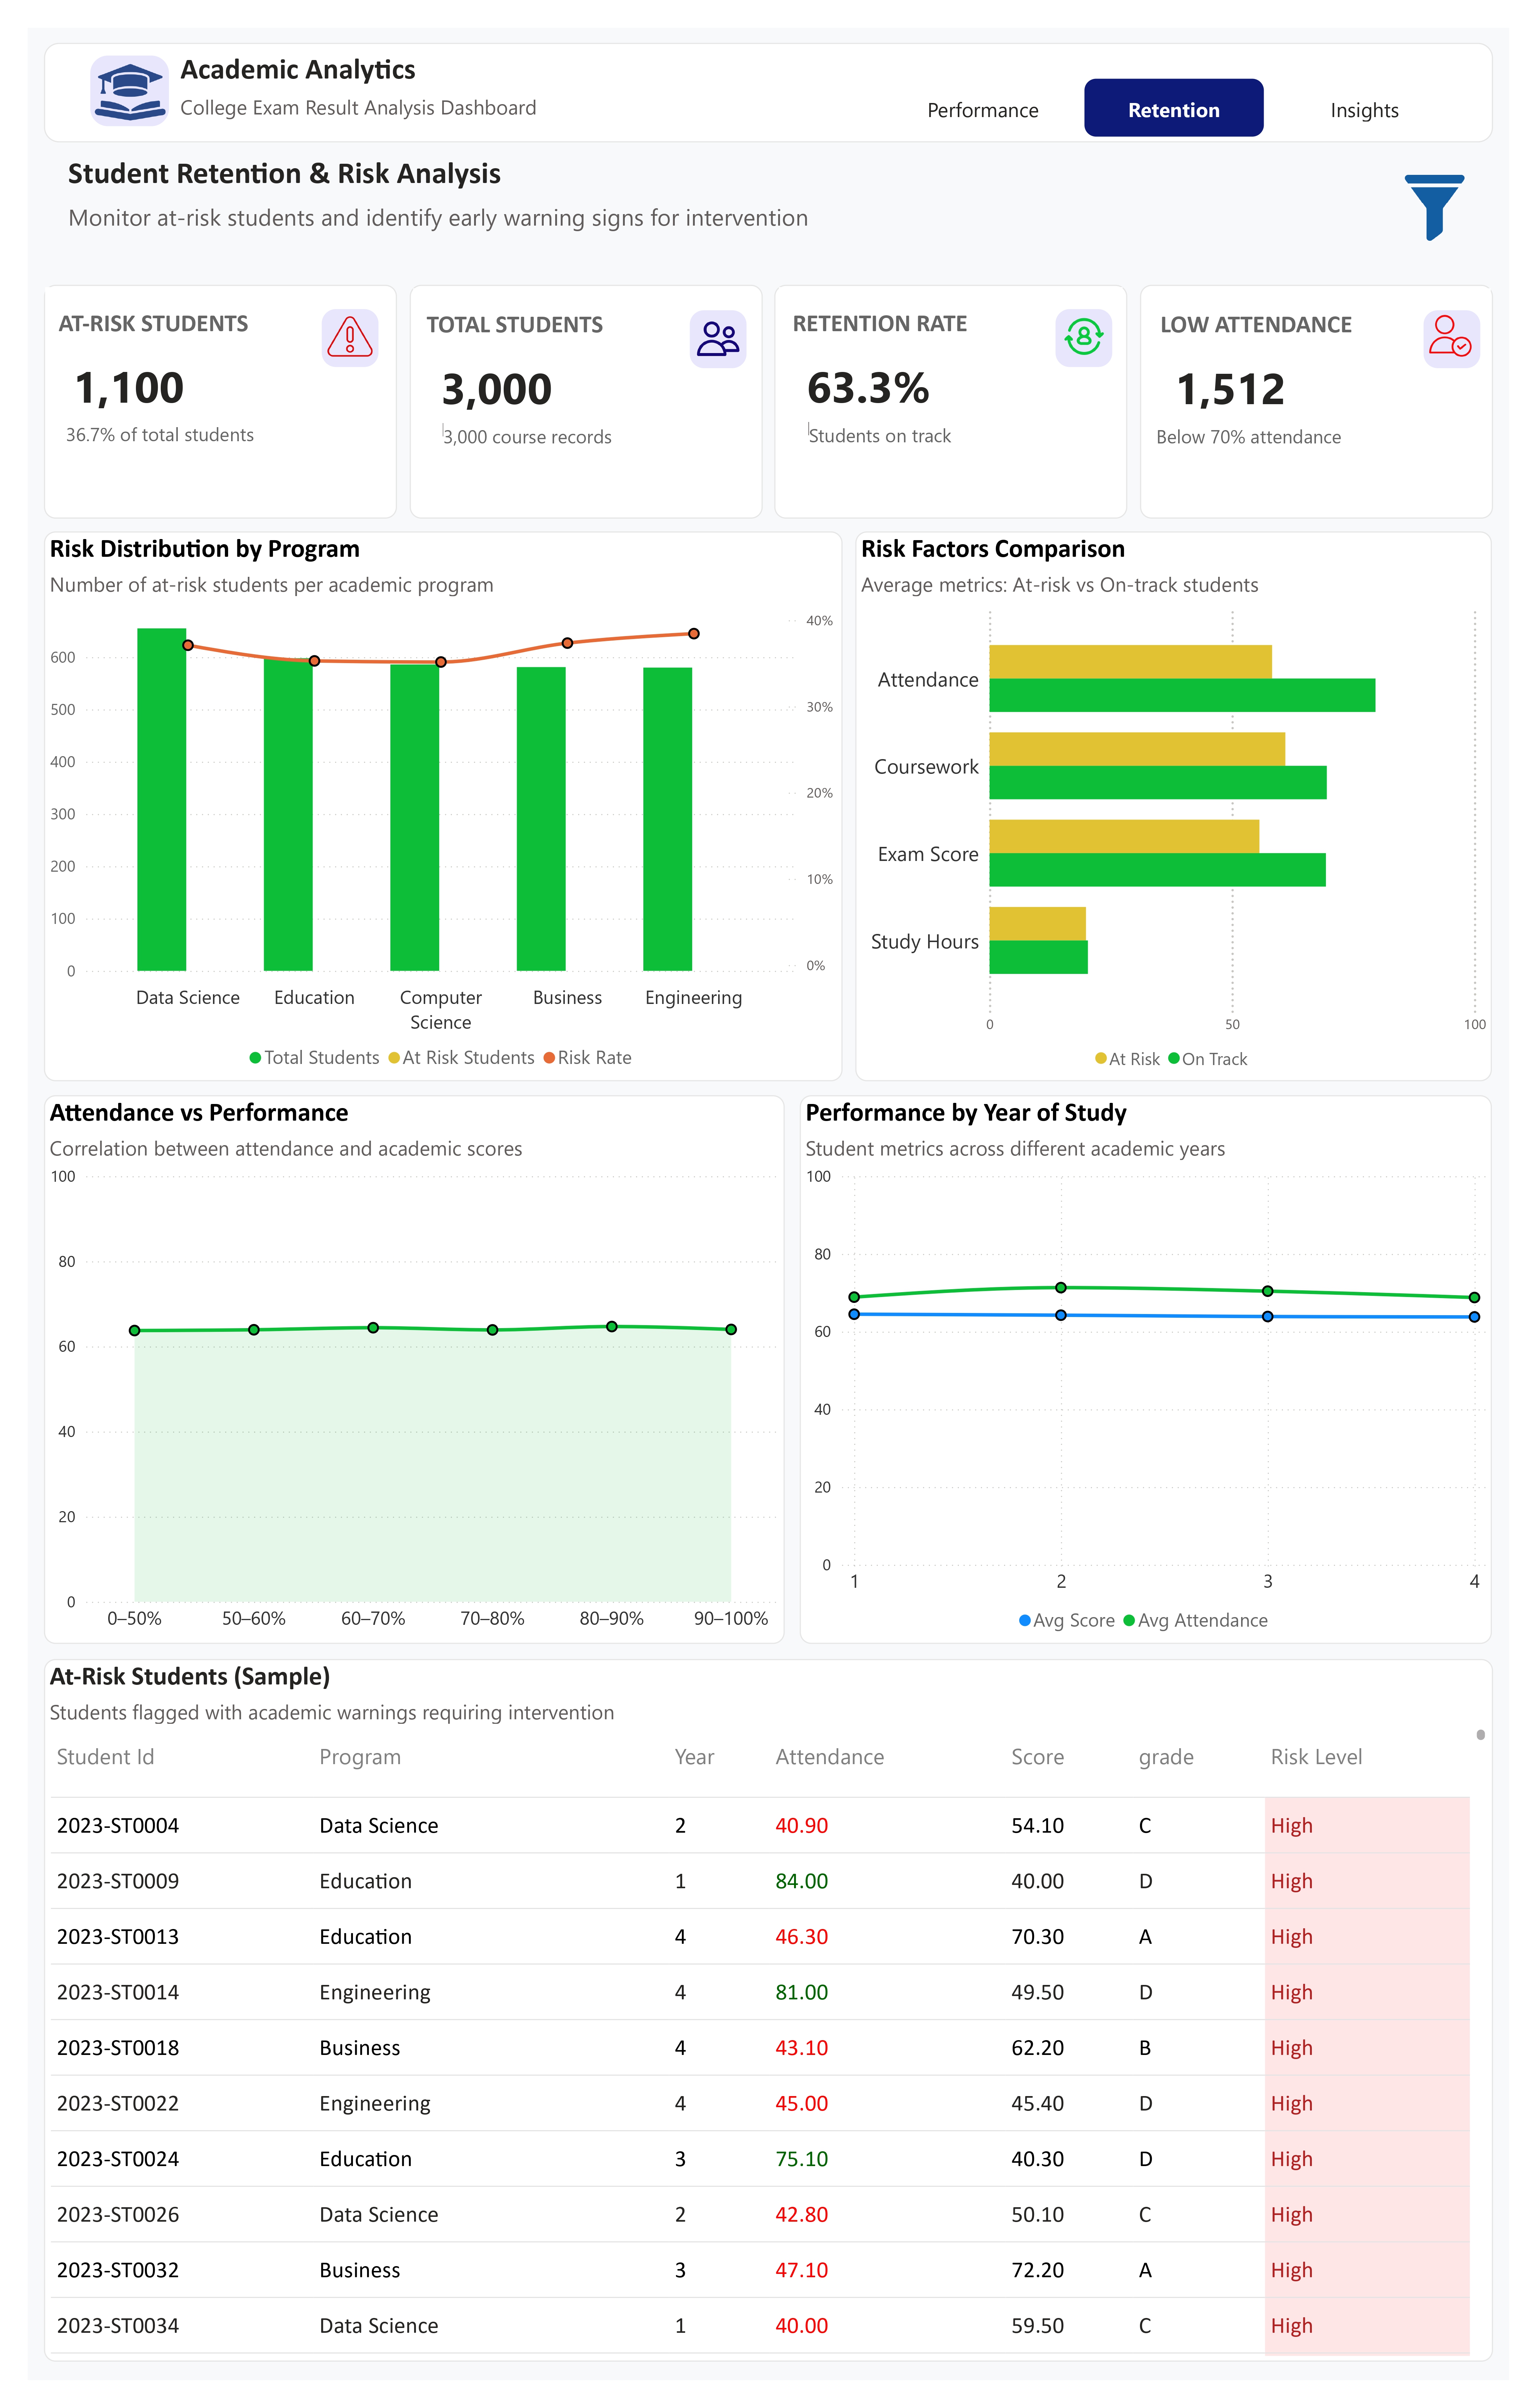
Key Insights
- Retention Is the Weakest Link:
- Retention rate: 63.3% → this is low.
- 1,100 at-risk students (36.7%) — that’s not a warning, that’s a fire alarm.
- Attendance Is the #1 Risk Driver:
- 1,512 students below 70% attendance.
- Attendance has a clear, direct relationship with performance.
- Even students with decent grades are flagged high-risk if attendance drops.
- Risk Is Consistent Across Programs:
- No program is immune.
- Risk rates hover around 35–40% everywhere.
- This confirms the problem is institutional, not departmental.
- High Grades ≠ Low Risk:
- Some A and B students are still marked high risk due to: Low attendance, Inconsistent engagement
- This is an early-warning goldmine.
- Year of Study Matters:
- Performance and attendance peak around Year 2–3, then dip.
- Likely causes:Burnout, External responsibilities, Reduced academic monitoring
Recommendations
- Attendance-Based Early Warning System:
- Auto-flag students when attendance drops below 75%, not 70%.
- Trigger advisor outreach immediately.
- Separate “Academic Risk” from “Engagement Risk”:
- Not all risks are about grades.
- Build dual risk scores: Academic (scores), Behavioral (attendance, consistency)
- Prioritize High-Risk High-Potential Students:
- Students with A/B grades but low attendance are salvageable.
- Personalized interventions here give the highest ROI.
- Year 3–4 Retention Programs:
- Mentorship
- Career-aligned projects
- Flexible attendance options
- These students don’t need basics — they need relevance.
_________________________________________________________________________________________________________________________________________Dashboard 3: Inisghts Dashboard
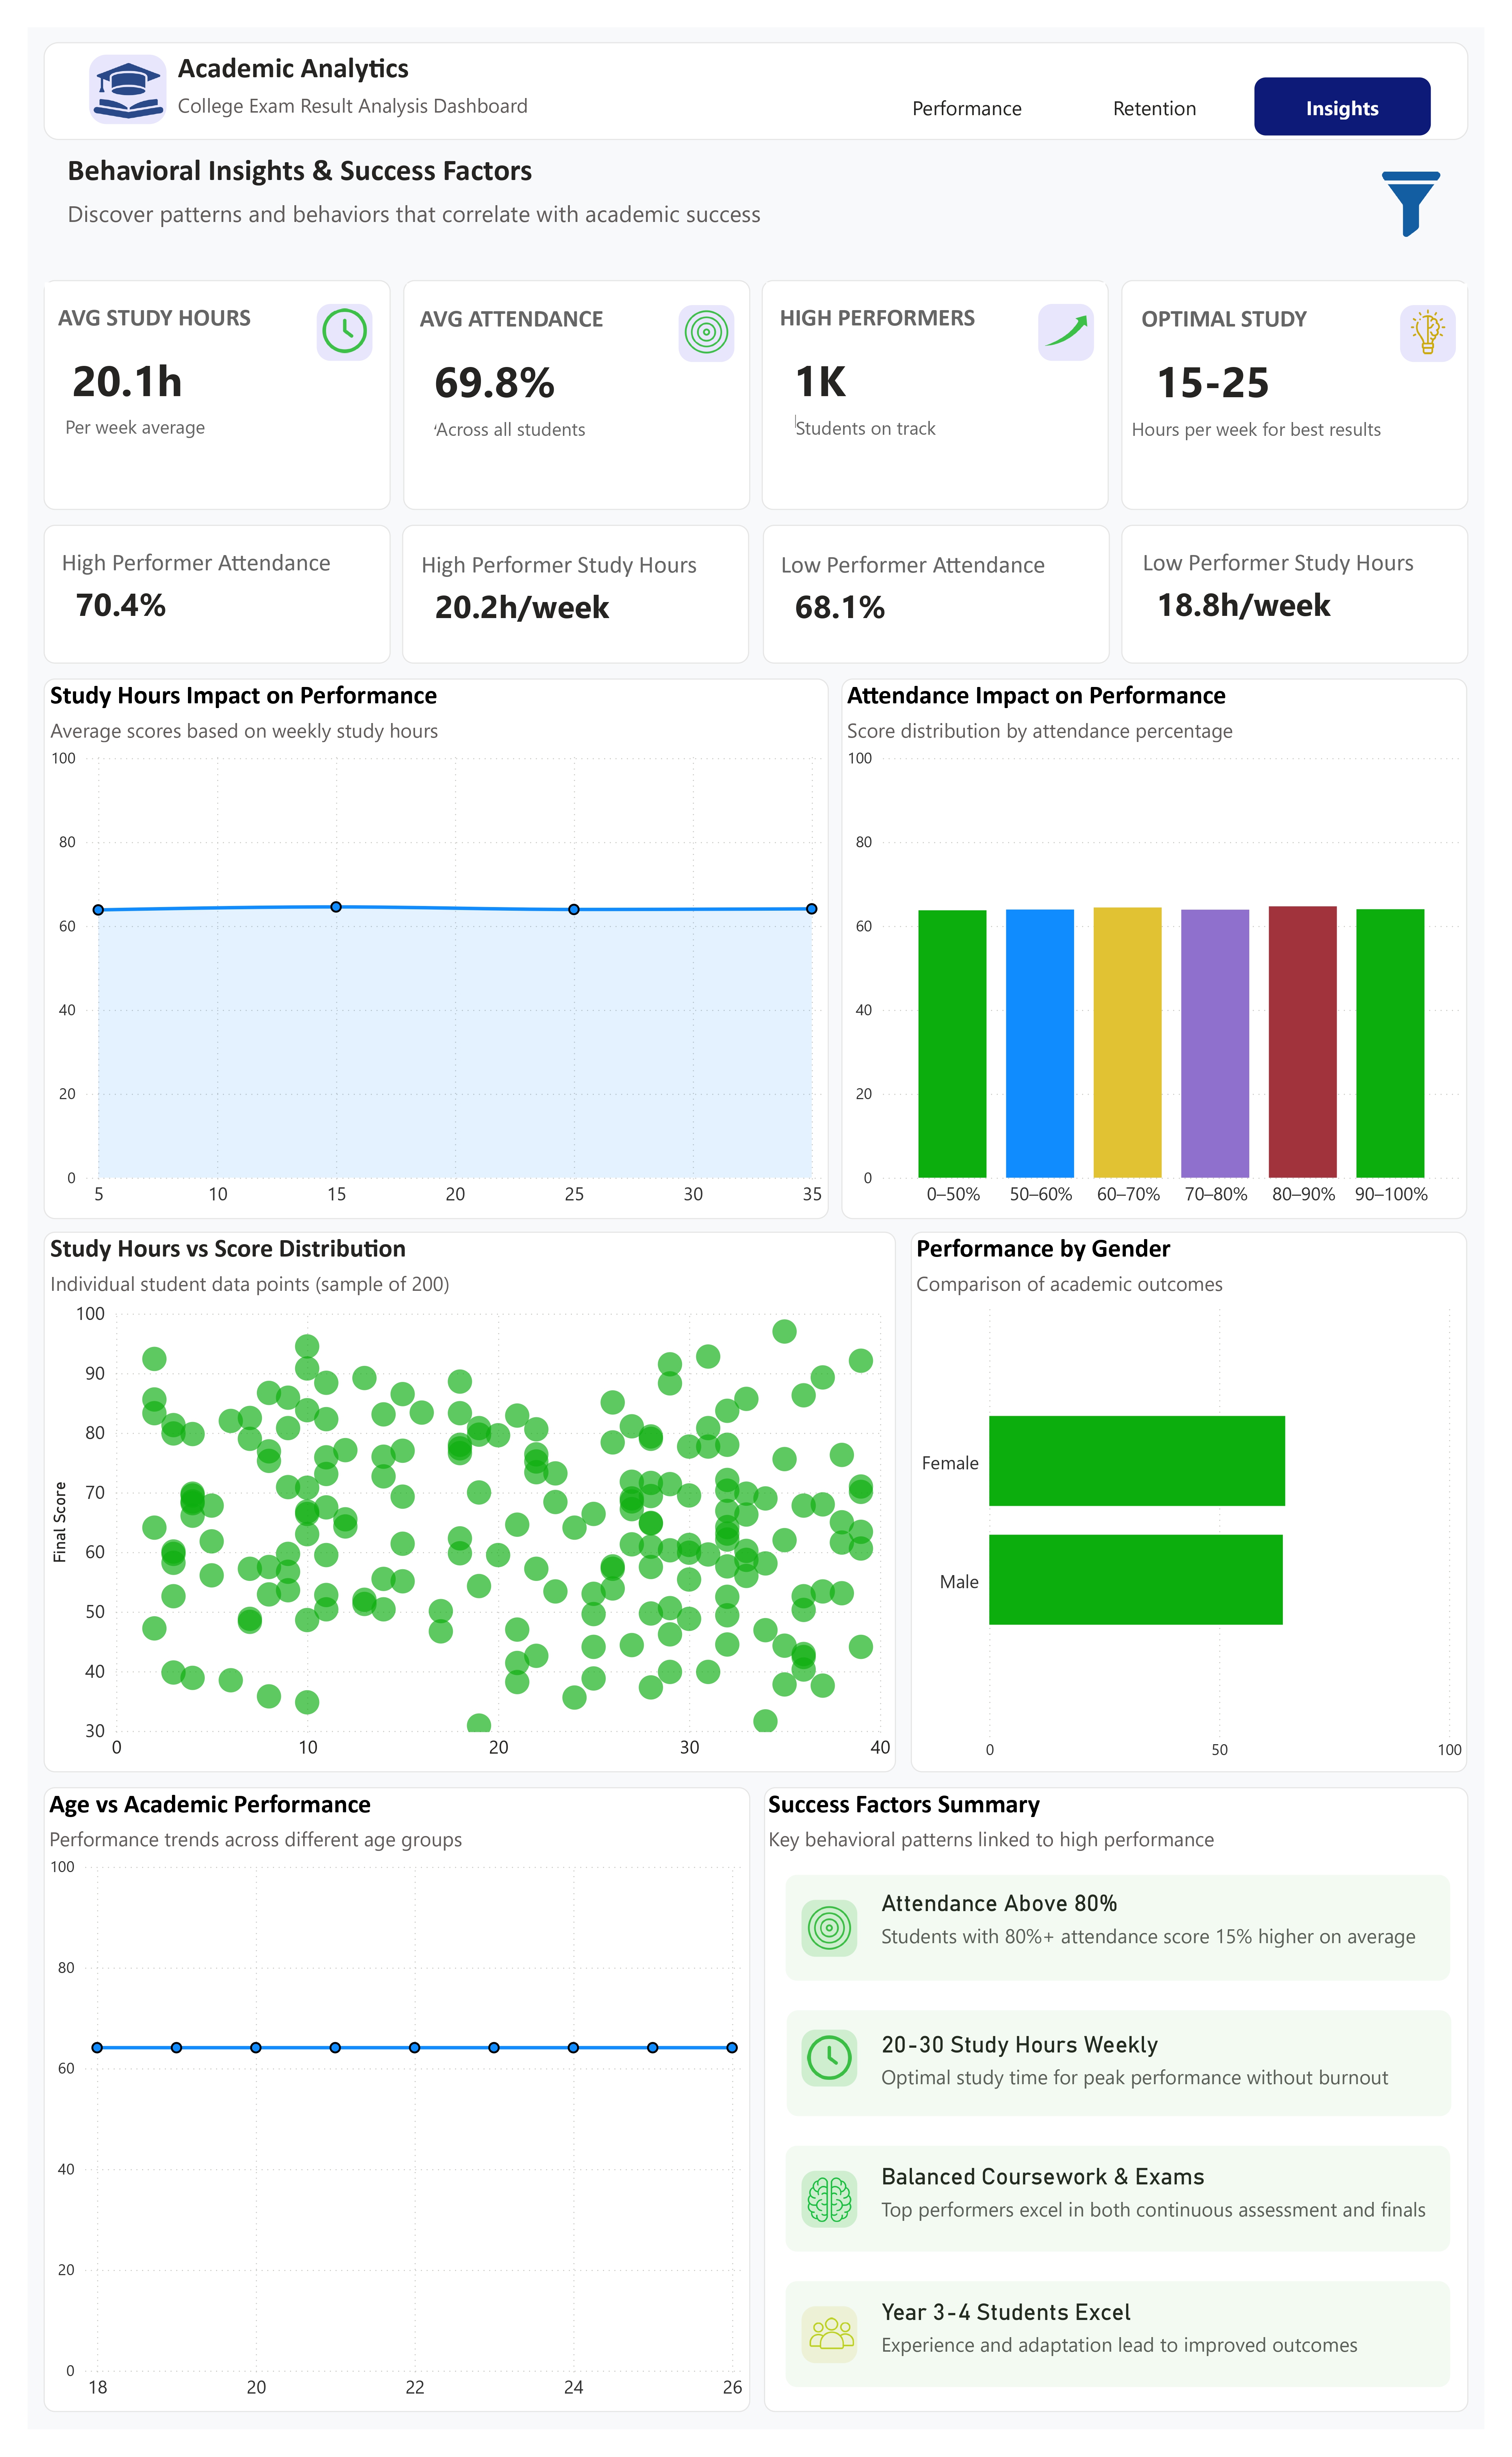
Key Insights
- Optimal Study Time Exists — And More Isn’t Better:
- Best performance occurs at b15–25 hours/week.
- Hustle culture ≠ smart studying.
- Attendance Is a Stronger Predictor Than Study Hours:
- Students with 80%+ attendance score ~15% higher.
- Study hours show weak correlation alone.
- Being present beats studying longer.
- High vs Low Performers Aren’t That Different in Time:
- High performers: 20.2 hrs/week
- Low performers: 18.8 hrs/week.
- Difference is quality, not quantity.
- Gender and Age Have Minimal Impact:
- Performance is consistent across: Gender, Age (18–26)
- This confirms: Fair assessment systems, No demographic bias
- Senior Students Perform Better:
- Year 3–4 students outperform juniors.
- Experience, adaptation, and exam familiarity matter.
Recommendations
- Teach Study Strategy, Not Study Hours:
- Promote: Active recall, Spaced repetition, Exam-focused revision.
- Stop encouraging “study longer” messaging.
- Make Attendance Non-Negotiable:
- Attendance policies are not administrative — they are academic tools.
- Incentivize 80%+ attendance with: Bonus marks, Priority access to resources
- Design for Sustainable Performance:
- Encourage 20-hour study models.
- Actively discourage burnout behaviors.
- Leverage Senior Students:
- Peer tutoring
- Mentorship programs
- “How to pass this course” sessions led by Year 3–4 students
_________________________________________________________________________________________________________________________________________Final Summary
This academic analytics project demonstrates how performance, retention, and behavioral data can be integrated to identify at-risk students, uncover drivers of success, and guide data-driven academic interventions. While pass rates remain high, stagnant average scores and low retention highlight the need to shift focus from survival to excellence. Attendance emerged as the most critical predictor of both performance and retention, outperforming study hours and demographic factors. The analysis provides actionable insights for early-warning systems, targeted student support, and policy-level academic improvements.