E-Commerce Performance Dashboard | Case Study
____________________________________________________________________________________________________________________________________________Project Overview
This project is designed to analyze and visualize E-commerce sales, profit, customer behavior, and product performance using a structured data-driven approach. The objective was to build a system that transforms raw transactional data into insightful dashboards that can guide strategic decisions for executives, marketing teams, and product managers.
The project consists of three interconnected dashboards:
- Executive Summary Dashboard –A high-level overview for executives.
- Product Performance Dashboard –Detailed insights for product managers.
- Customer Insights Dashboard –Behavioral analysis for marketing teams.
Together, these dashboards allow stakeholders to gain both macro-level insights (overall company performance) and micro-level insights (specific customers and products driving growth).
Process Followed:
- Data Preparation: Used Python to generate a synthetic e-commerce dataset with 9,000+ records. Cleaned and transformed the data using SQL queries to ensure accuracy and consistency.
- Exploratory Data Analysis (EDA): Conducted EDA using SQL to identify trends, outliers, and key metrics such as total sales, profit margins, and customer counts.
- Dashboard Design: Created an interactive Tableau dashboard that visualizes sales and profit trends over time, product category performance, customer segmentation, and geographic distribution of sales.
- Insights & Recommendations: Analyzed the dashboard to extract actionable insights and provide recommendations for business improvement.
Technologies Used:
- Python:Dataset generation & preprocessing
- SQL:Data cleaning, transformation, and analysis
- Tableau:Dashboard design and interactive visualizations for Data Storytelling
- Business Analysis:Identifying key metrics and insights for e-commerce performance
🔹 Dashboard 1: Executive Summary Dashboard –Strategic View
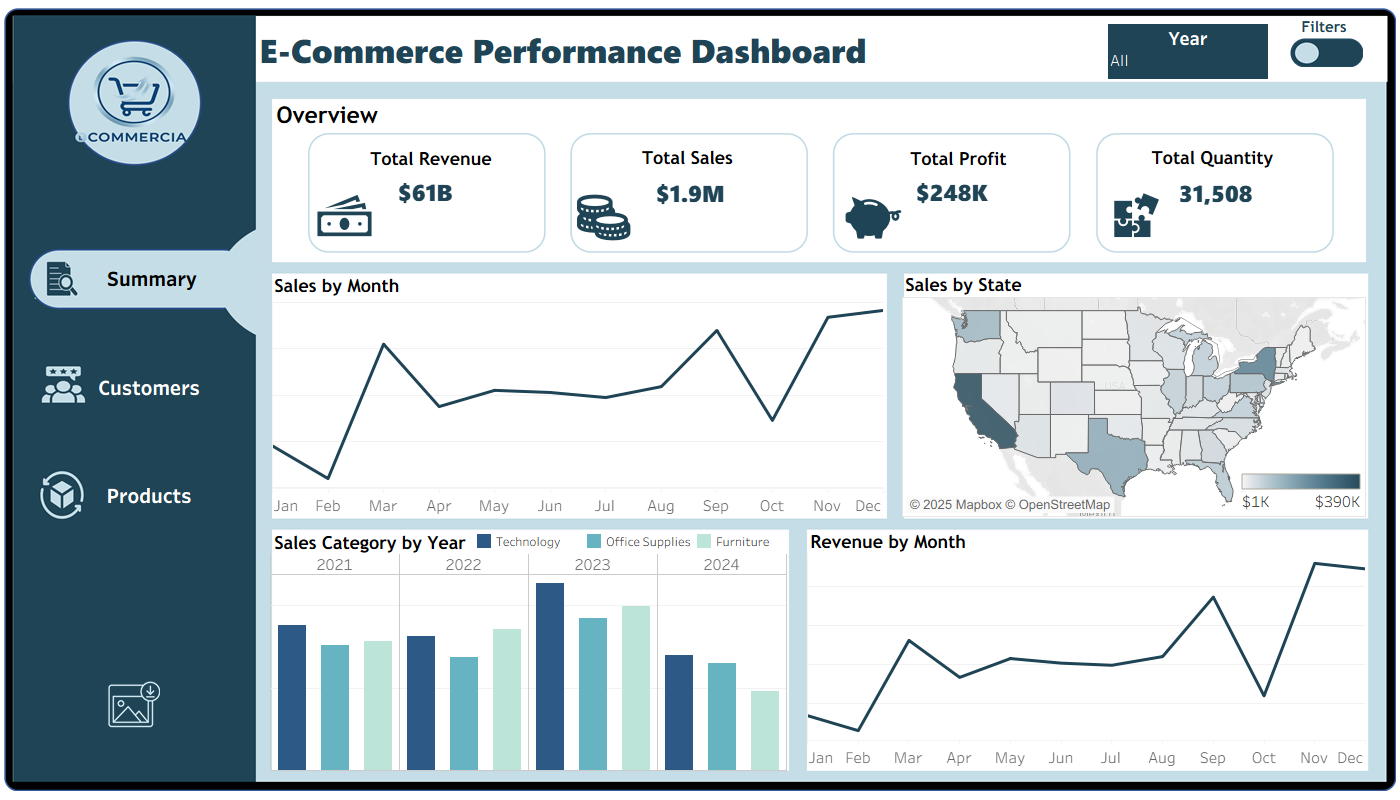
Key Insights
- $61B Total Revenue, $1.9M Total Sales, and $248K Profit, showing solid profitability and strong demand.
- 31,508 total items sold, proving consistent customer engagement and product movement.
- Sales peak during March and Q4 (Nov–Dec), aligning with holiday and promotional seasons.
- California, Texas, and New York dominate sales, while southern and midwestern states lag behind.
- Technology category consistently leads in sales across years, followed by Office Supplies and Furniture.
Recommendation
- Intensify marketing and discount campaigns in Q1 and Q4 to leverage peak demand.
- Target low-performing states with localized promotions and brand awareness campaigns.
- Diversify offerings — increase promotion of Office Supplies and Furniture to balance revenue streams.
- Use predictive analytics to forecast monthly sales and optimize marketing spend.
- Review supply chain and product margins to enhance overall profit efficiency.
🔹 Dashboard 2: Customer Dashboard –Operational View
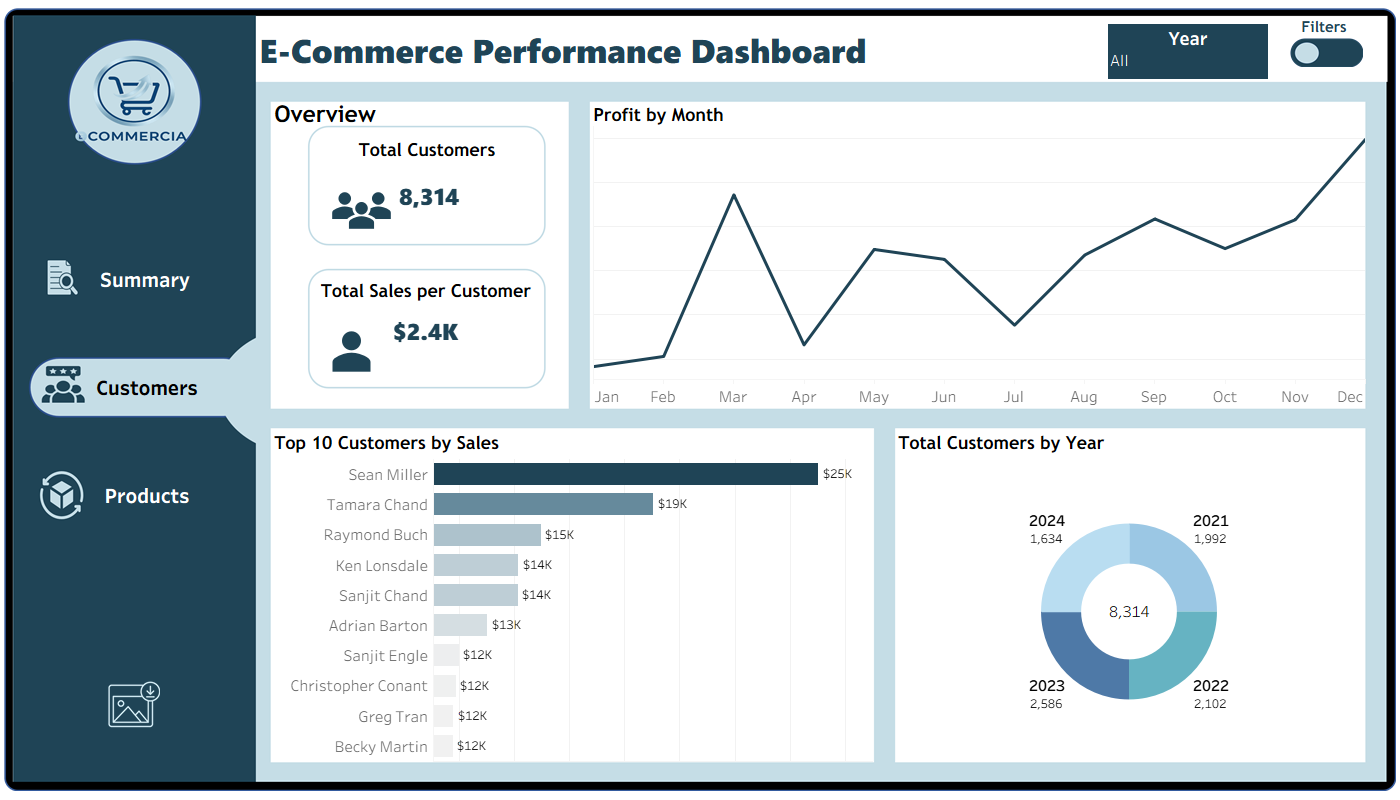
Key Insights
- The company has 8,314 total customers with an average $2.4K in sales per customer.
- Customer count grew steadily from 2021 to 2023, peaking at 2,586 in 2023, but declined in 2024, suggesting reduced acquisition or retention.
- Sean Miller and Tamara Chand are the top customers, contributing $25K and $19K in sales respectively, showing dependency on key clients.
- Profit peaks in March and December, implying strong seasonal trends possibly linked to promotions or holiday sales.
Recommendation
- Launch customer retention programs and loyalty rewards to maintain the positive growth trend.
- Reduce dependence on top clients by nurturing mid-tier customers through cross-sells and personalized marketing.
- Implement off-season campaigns during low-profit months (April–July) to balance monthly revenue flow.
- Investigate 2024’s customer decline to identify whether it’s due to competition, service gaps, or reduced marketing reach.
🔹 Dashboard 3: Product Dashboard –Analytical View
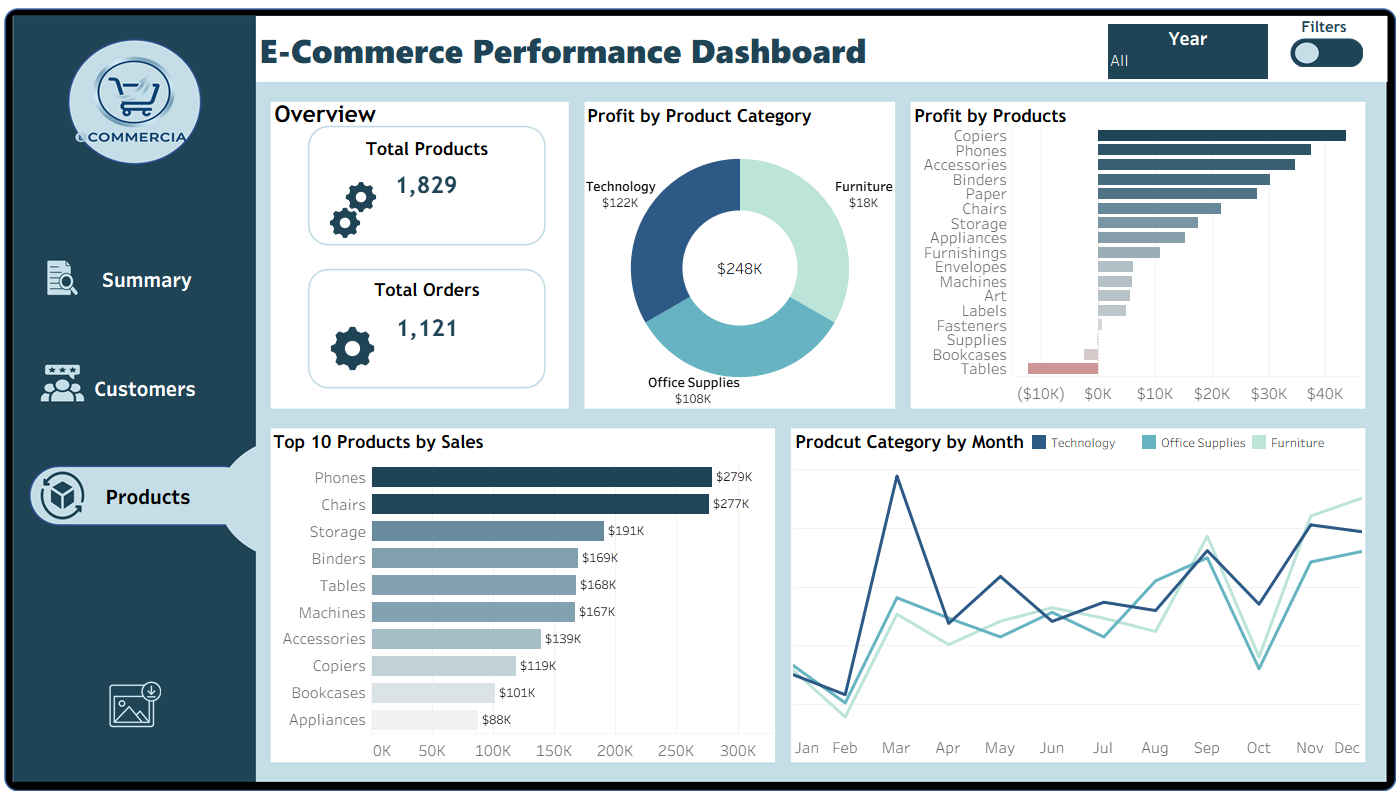
Key Insights
- The company manages 1,829 products and 1,121 orders, achieving a total profit of $248K.
- Technology ($122K) and Office Supplies ($108K) are the most profitable categories, while Furniture ($18K) lags behind.
- Phones and Chairs are top-selling products, each generating around $279K in sales, followed by Storage and Binders.
- Tables show negative profit, signaling losses or poor pricing strategy.
- Monthly trends highlight March and December as high-demand periods across categories.
Recommendation
- Prioritize high-performing categories like Technology and Office Supplies for future campaigns.
- Reevaluate pricing and inventory for low-profit items (e.g., Tables, Bookcases) to improve margin performance.
- Implement seasonal inventory planning to meet demand spikes in March and December efficiently.
- Introduce for underperforming categories to boost sales.
Next Step
The next phase will involve automating data updates through real-time database connections and expanding the dashboards with predictive analytics to forecast future trends in sales, customer behavior, and product demand. Integrating real company data will transition this dashboard from a demo prototype to a fully production-ready BI solution.