Executive Sales and Customer Dashboard | Case Study
_________________________________________________________________________________________________________________________________________Project Overview
This project provides a deep understanding of revenue trends, product performance, and customer behavior across different segments. The project leverages Microsoft Excel for data cleaning, analysis, and interactive dashboarding to reveal key business insights and performance gaps.- Sales Performance Dashboard – Tracks sales, profit, regional performance, and category insights.
- Customer Performance Dashboard – Focuses on customer segmentation, purchase patterns, and retention performance. Together, these dashboards offer a unified view of business health and empower management to make data-driven decisions that improve profitability and customer satisfaction.
The final deliverable includes two interactive dashboards built entirely in Tableau:
Data Workflow
- Data Collection & Cleaning: Cleaned raw transactional data in Excel, removing duplicates, handling missing values, and standardizing formats.
- Data Modeling: Created relationships between sales transactions, products, and customers for efficient analysis.
- Analysis & Visualization: Visualized KPIs like Total Sales, Profit, and AOV using charts, slicers, and filters.
- Dashboard Design: Focused on intuitive, color-coded layouts for actionable insights.
Technology Used
- Microsoft Excel: Data cleaning, analysis, and visualization
- Tableau Desktop: Dashboard creation and interactive visualizations
🔹 Dashboard 1:
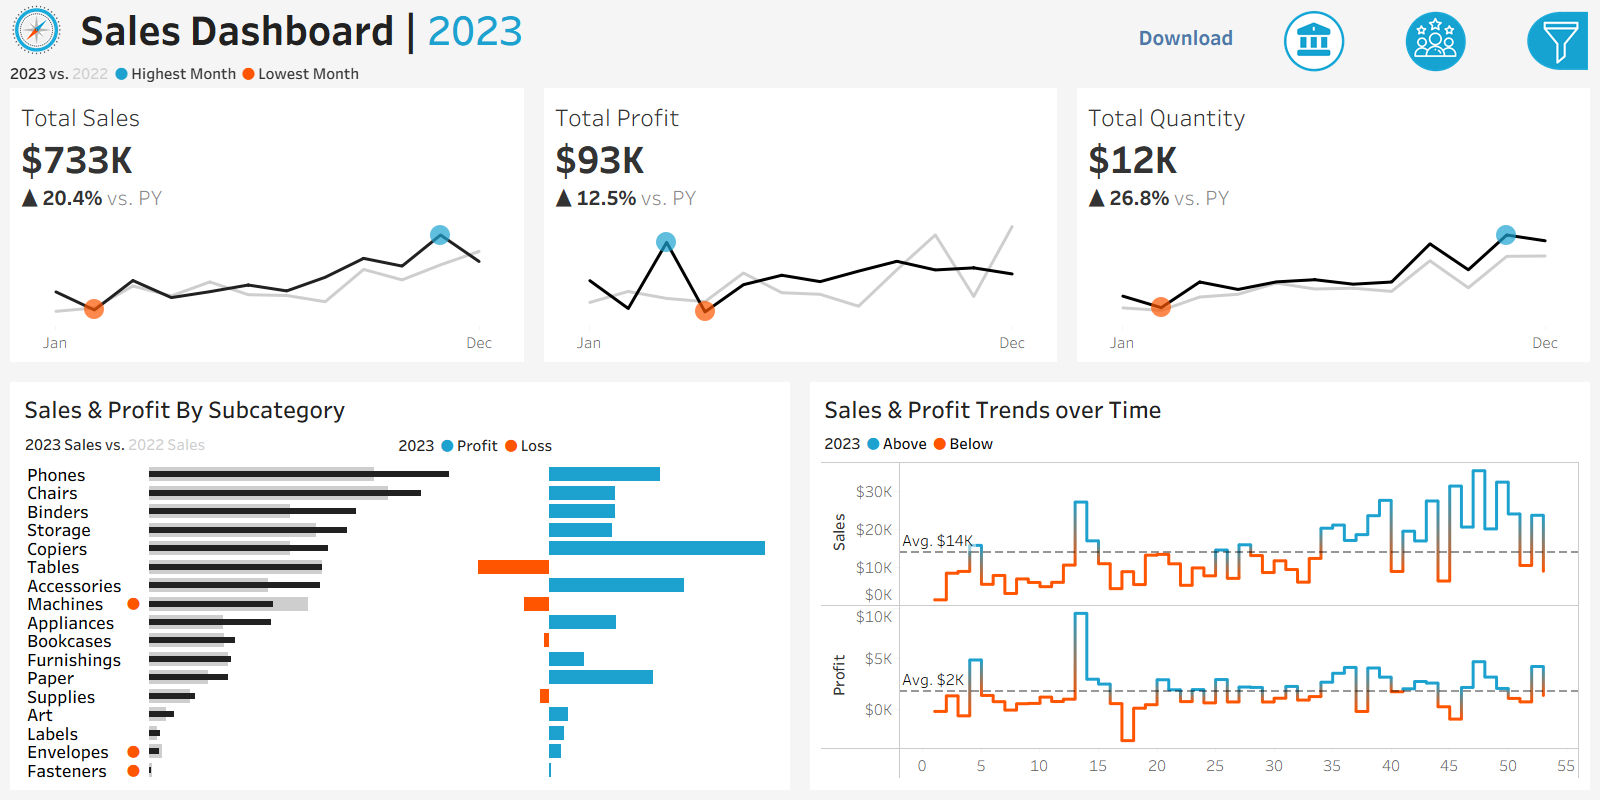
Key Insights
- Total sales and profit increased steadily between 2021–2024.
- West region recorded the highest profit margins, while South lagged.
- Technology products generated the highest revenue share.
- Q4 shows consistent peak demand due to promotions.
Recommendations
- Expand high-margin Technology products.
- Boost supply chain efficiency in weaker regions.
- Strengthen Q4 marketing campaigns.
- Introduce bundle pricing to raise order values.
🔹 Dashboard 2:
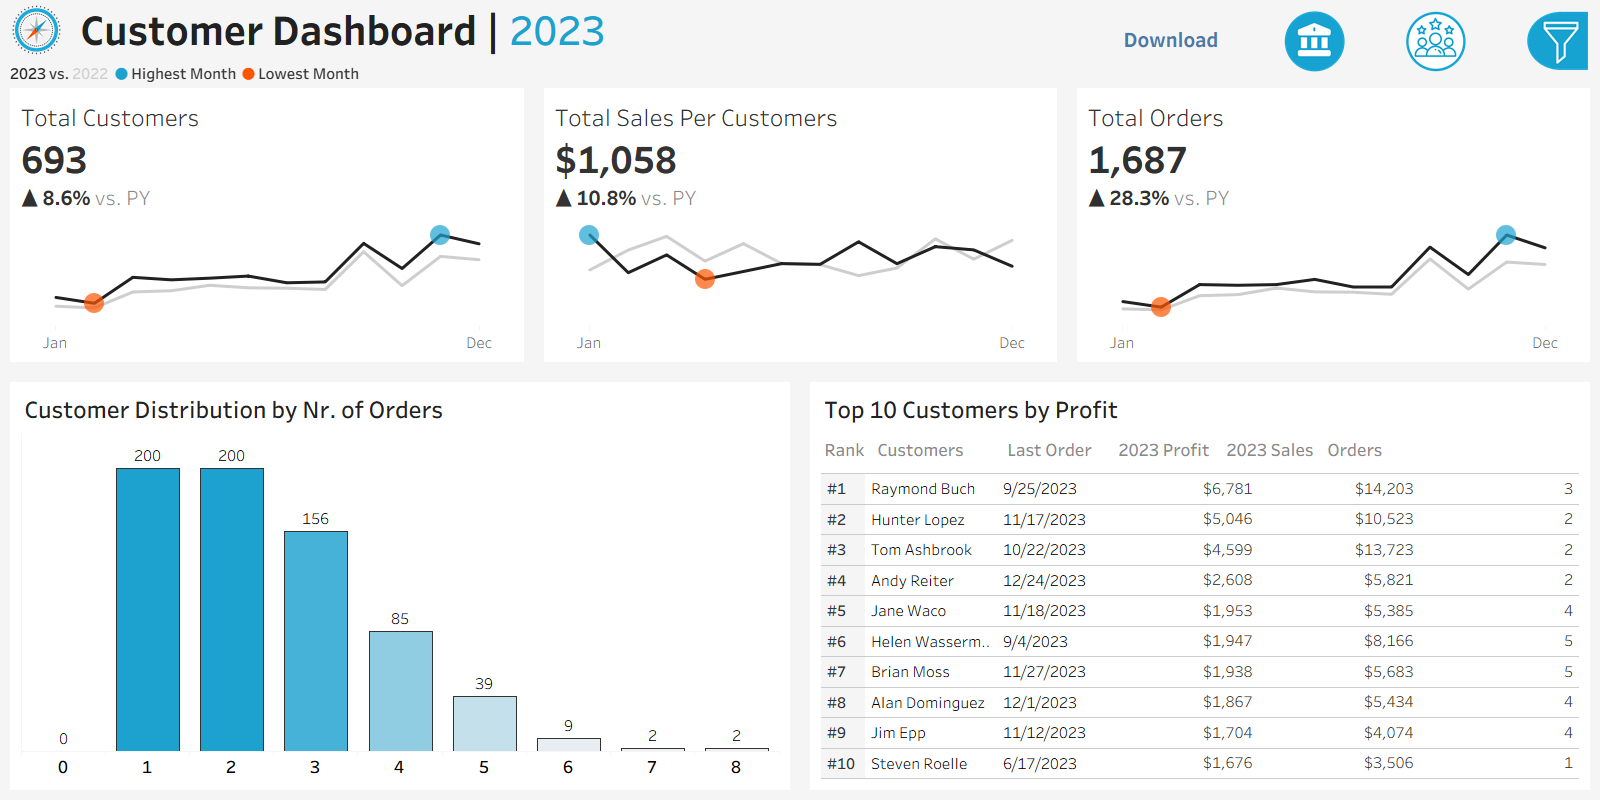
Key Insights
- Returning customers drive over 60% of total sales.
- High-value customers dominate Corporate and Home Office segments.
- Moderate new customer growth suggests outreach gaps.
- Increasing customer lifespan signals improving engagement.
Recommendations
- Reward loyal customers via retention programs.
- Use targeted email marketing for new customer acquisition.
- Track customer feedback to refine service.
- Deepen engagement with top-tier clients.
Next Steps
- Integrate Tableau with live Excel/SQL connections.
- Automate dashboard refreshes for real-time tracking.
- Use predictive analytics to forecast trends & retention.