Human Resource Analytics Dashboard | Case Study
__________________________________________________________________________________________________________________________________________Project Overview
This project designed a two-part HR Analytics Dashboard in Tableau using a synthetic dataset generated with Python’s Faker library. The dashboards help HR teams monitor workforce metrics, understand demographics, track performance, and explore salary trends.The solution includes:
- Summary Dashboard – Executive-level view of workforce KPIs.
- Detail Dashboard – Employee-level drill-down for HR operations.
Business Problem
The company lacked a unified system to monitor key business metrics such as total sales, customer distribution, and employee performance. Reports were scattered across departments, making it difficult for management to make timely and informed decisions. The goal was to build centralized dashboards that simplify performance tracking, identify bottlenecks, and reveal patterns across sales and workforce data.
Process
- Data Generation
Used Faker to simulate realistic HR records and distributions (age, salary, hire dates).
- Cleaning & Preparation
Validated and cleaned data in Excel; created calculated fields for KPIs (Active Employees, Termination Rate, Salary Bands).
- Dashboard Design
Built Summary and Detail dashboards in Tableau with filters, parameters, and interactive elements for exploration.
Technologies Used
- Python (Faker): Data generation
- Excel: Preprocessing & validation
- Tableau: Dashboard creation & visualization
🔹 Dashboard 1: Summary Dashboard — Strategic View
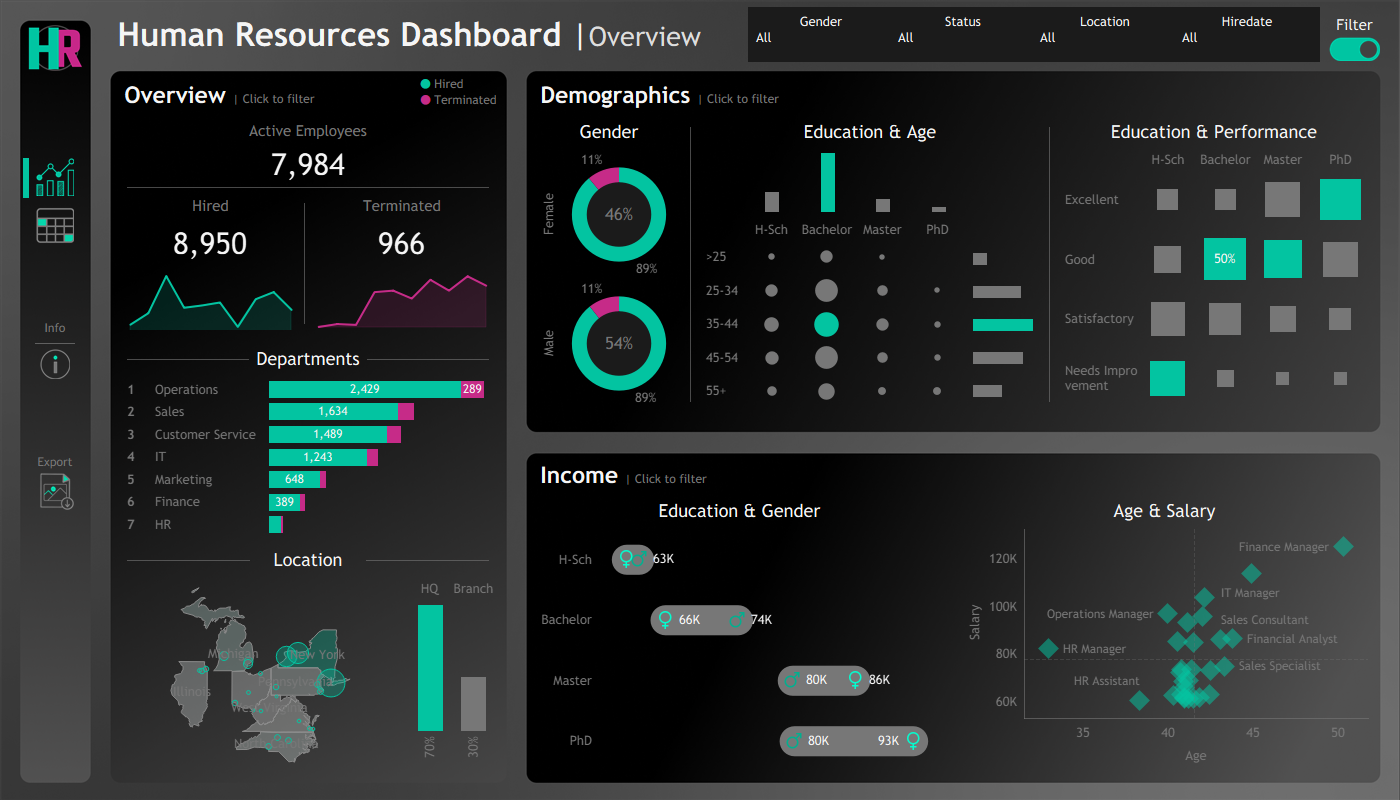
Key Insights
- The company’s total sales and profit trends reveal strong performance in key regions.
- Top-performing regions drive a majority of revenue, while others show growth potential.
- Customer segmentation highlights that loyal and returning customers contribute significantly to profit stability.
- Product category analysis shows Technology leading in sales, followed by Office Supplies and Furniture.
Recommendation
- Reinforce inventory and marketing strategies in the top-performing regions.
- Create loyalty programs to further engage repeat customers.
- Improve pricing and promotion strategies in underperforming categories.
🔹 Dashboard 2: Detail Dashboard — Operational View
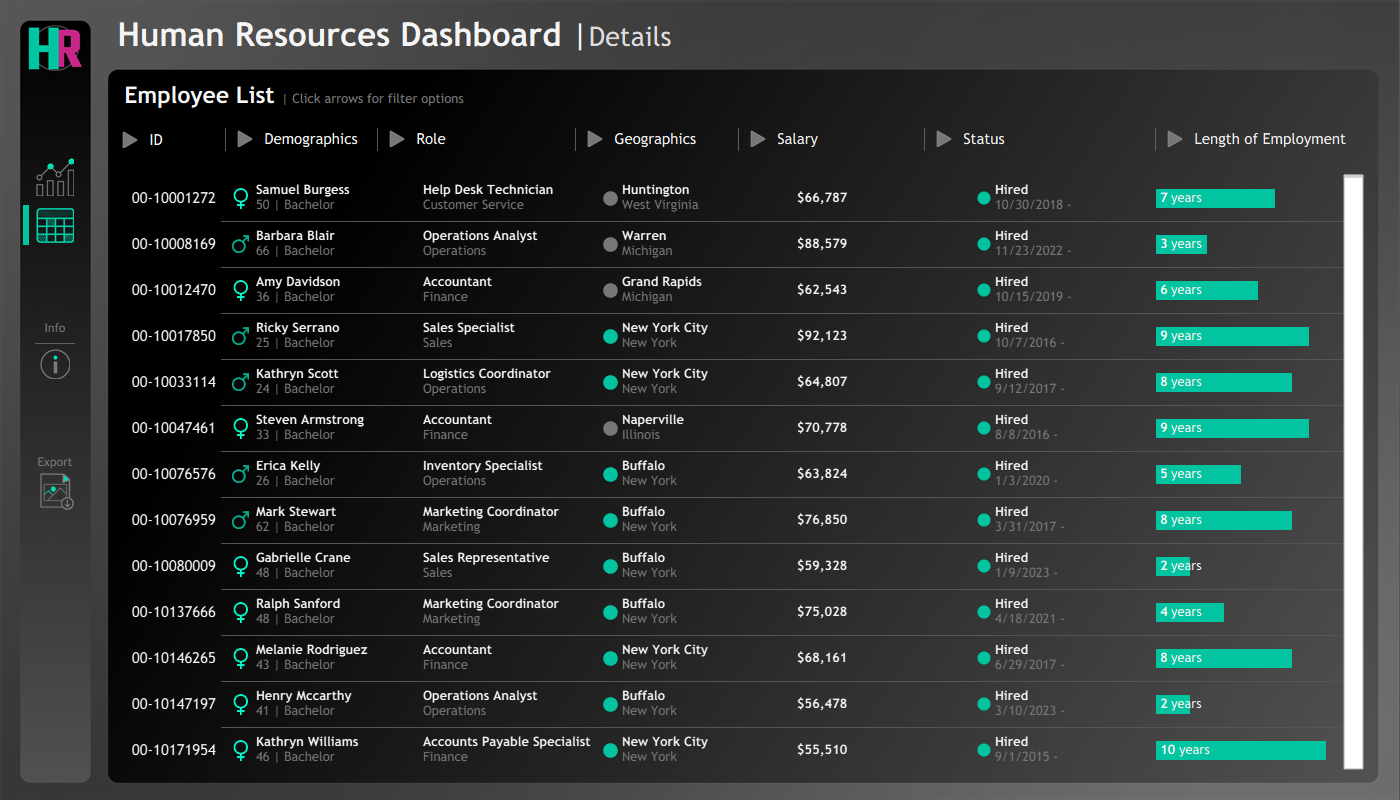
Key Insights
- The top 5 employees consistently achieve above-average sales targets.
- Regional sales distribution reveals concentration in specific areas, suggesting uneven workforce deployment.
- Monthly performance analysis indicates periods of high and low productivity — ideal for performance planning and resource allocation.
Recommendation
- Recognize and reward high performers to maintain motivation.
- Rebalance staff assignments to boost underperforming regions.
- Implement monthly training or performance reviews to improve consistency.
Next Step
The next phase will focus on automating data updates and expanding the dashboards with predictive analytics to forecast future sales and performance trends. Integrating data from real business systems will make the dashboards production-ready and enhance decision-making accuracy.