US Residential Market Analysis | Case Study
_______________________________________________________________________________________________________________________________________________Project Overview
This is a comprehensive Business Intelligence project designed to provide executive leadership and operational teams with a single source of truth for market share concentration, agent productivity, and inventory valuation. The project successfully transformed raw, heterogeneous listing data into a unified Star Schema, culminating in four highly actionable dashboards: Overview, Geographic, Properties, and Agents.
Business Challenge
The organization suffered from fragmented, unnormalized listing data, preventing them from accurately quantifying performance and competitive standing. This obscured answers to high-stakes questions:
- Competitive Penetration: Where are the agency's highest Market Share opportunities (Geographic Dashboard)?
- Productivity vs. Value: Does high agent transaction volume translate to high total Value, or is there a revenue gap (Agents Dashboard)?
Business Goal
To implement a unified platform that delivers specific, measurable insights across the four reporting areas:
- Overview: for Inventory Health Check
- Geographic: for Market Concentration
- Properties: for Valuation Segmentation
- Agents: for Performance Ranking
Methodology
The project followed an end-to-end data analytics workflow:
- Data Engineering (SQL): Used SQL Server for initial data warehousing and cleansing, standardizing date/time fields, and enforcing integrity across the three disparate source tables.
- Exploratory Analysis (Python): Performed EDA for data validation and aggregation confirmed distributions (e.g., price ranges) before modeling.
- Modeling & Visualization (Power BI & DAX): Built a robust Star Schema model, created complex DAX measures, and designed Four interconnected dashboards for final insight delivery.
Technology Used
- Data Engineering: SQL Server
- Exploratory Analysis: Python (Pandas, NumPy, Matplotlib)
- Business Intelligence: Power BI Desktop (DAX)
Dashboard 1: Overivew
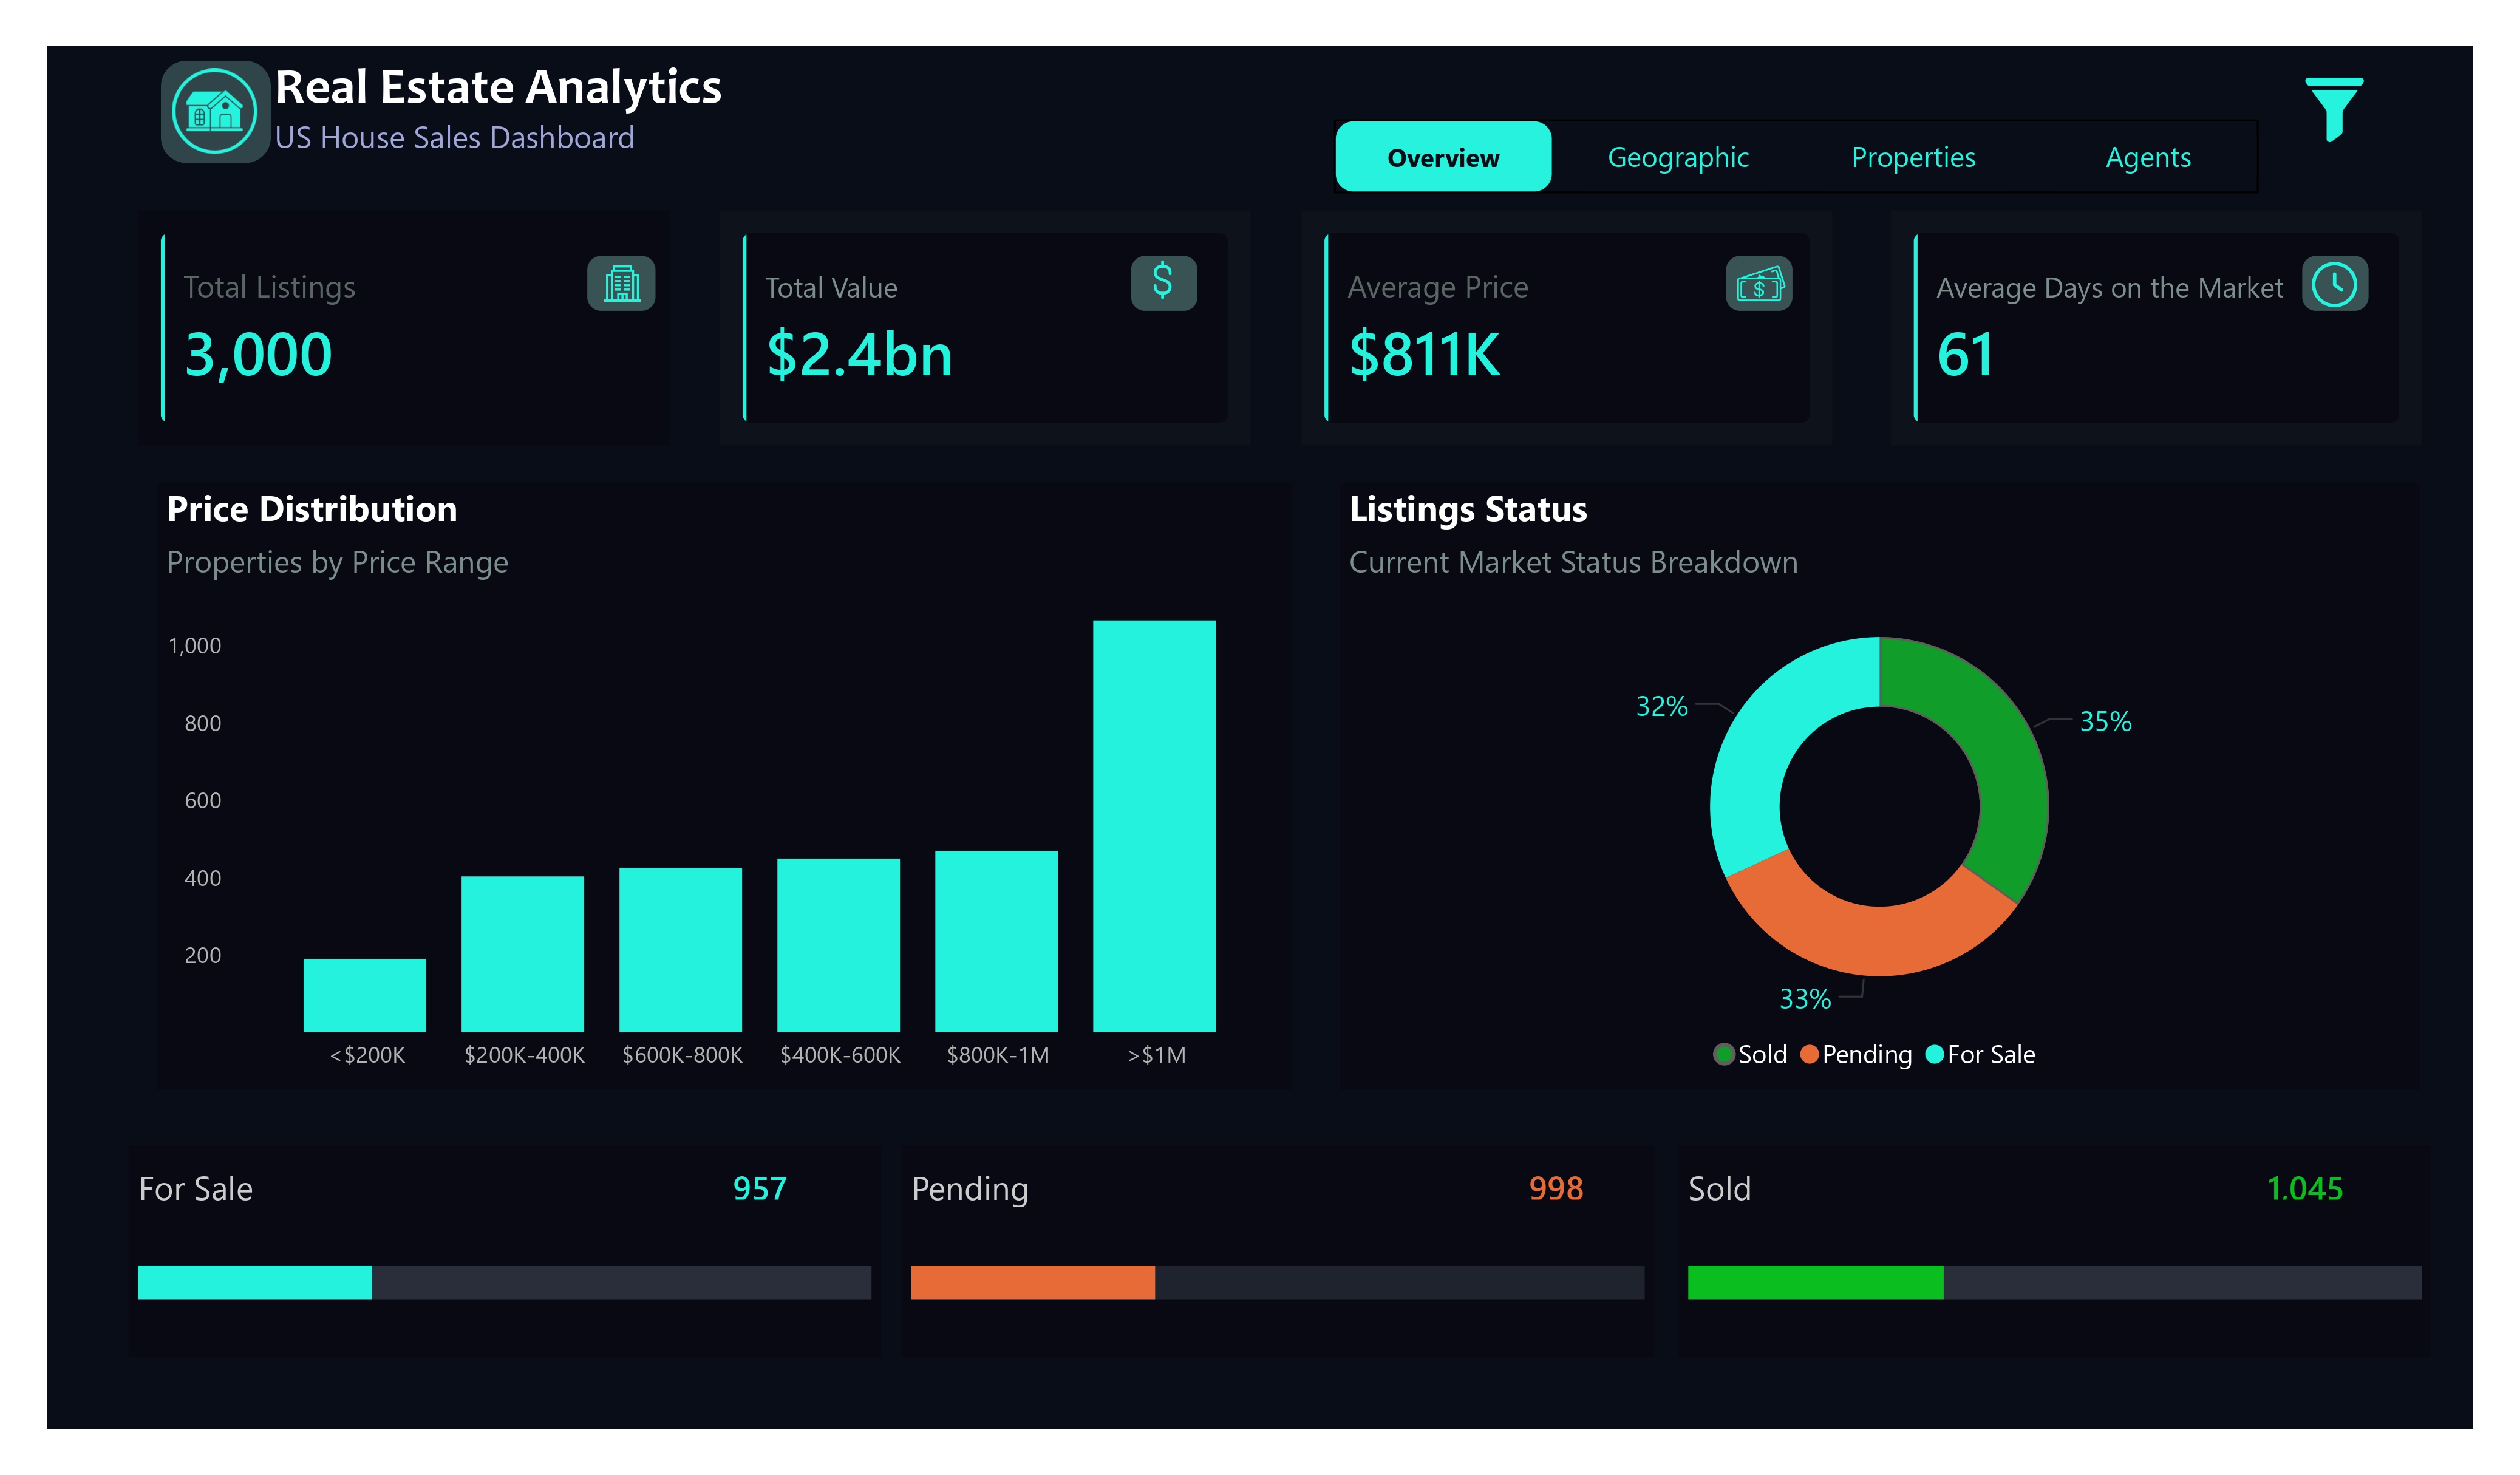
- Market Balance: The listing status distribution shows: - Sold: 35% - Pending: 33% - For Sale: 32%
This indicates a balanced and healthy market, with steady transaction flow and no extreme supply-demand imbalance - Price Distribution: Listings are heavily concentrated in the high-end price segment (greater $1M), while lower-priced homes (less than $200K) are scarce.
This suggests: - Strong presence of luxury inventory - Limited availability for first-time or budget-conscious buyers - Market Liquidity: An average of 61 days on market suggests moderate liquidity: - Homes are selling, but not instantly - Buyers retain some negotiation power
- Sales Funnel Efficiency: Nearly two-thirds of listings are either pending or sold, highlighting effective conversion from active listings to completed transactions.
Insights
- Luxury Market Focus
The dominance of high-priced listings indicates strong opportunities for luxury developers and investors. - Affordable Housing Opportunity
The limited supply of low-priced homes highlights an underserved segment with potential for high demand and fast absorption. - Pricing Optimization
Reducing overpricing at listing stage could shorten days on market and improve liquidity. - Improve Pending-to-Sold Conversion
Enhancing deal execution and buyer qualification could increase sales volume without increasing inventory. - Segment-Specific Strategy
Different pricing tiers require tailored marketing and pricing approaches to maximize performance.
Recommendation
Dashboard 2: Geographic
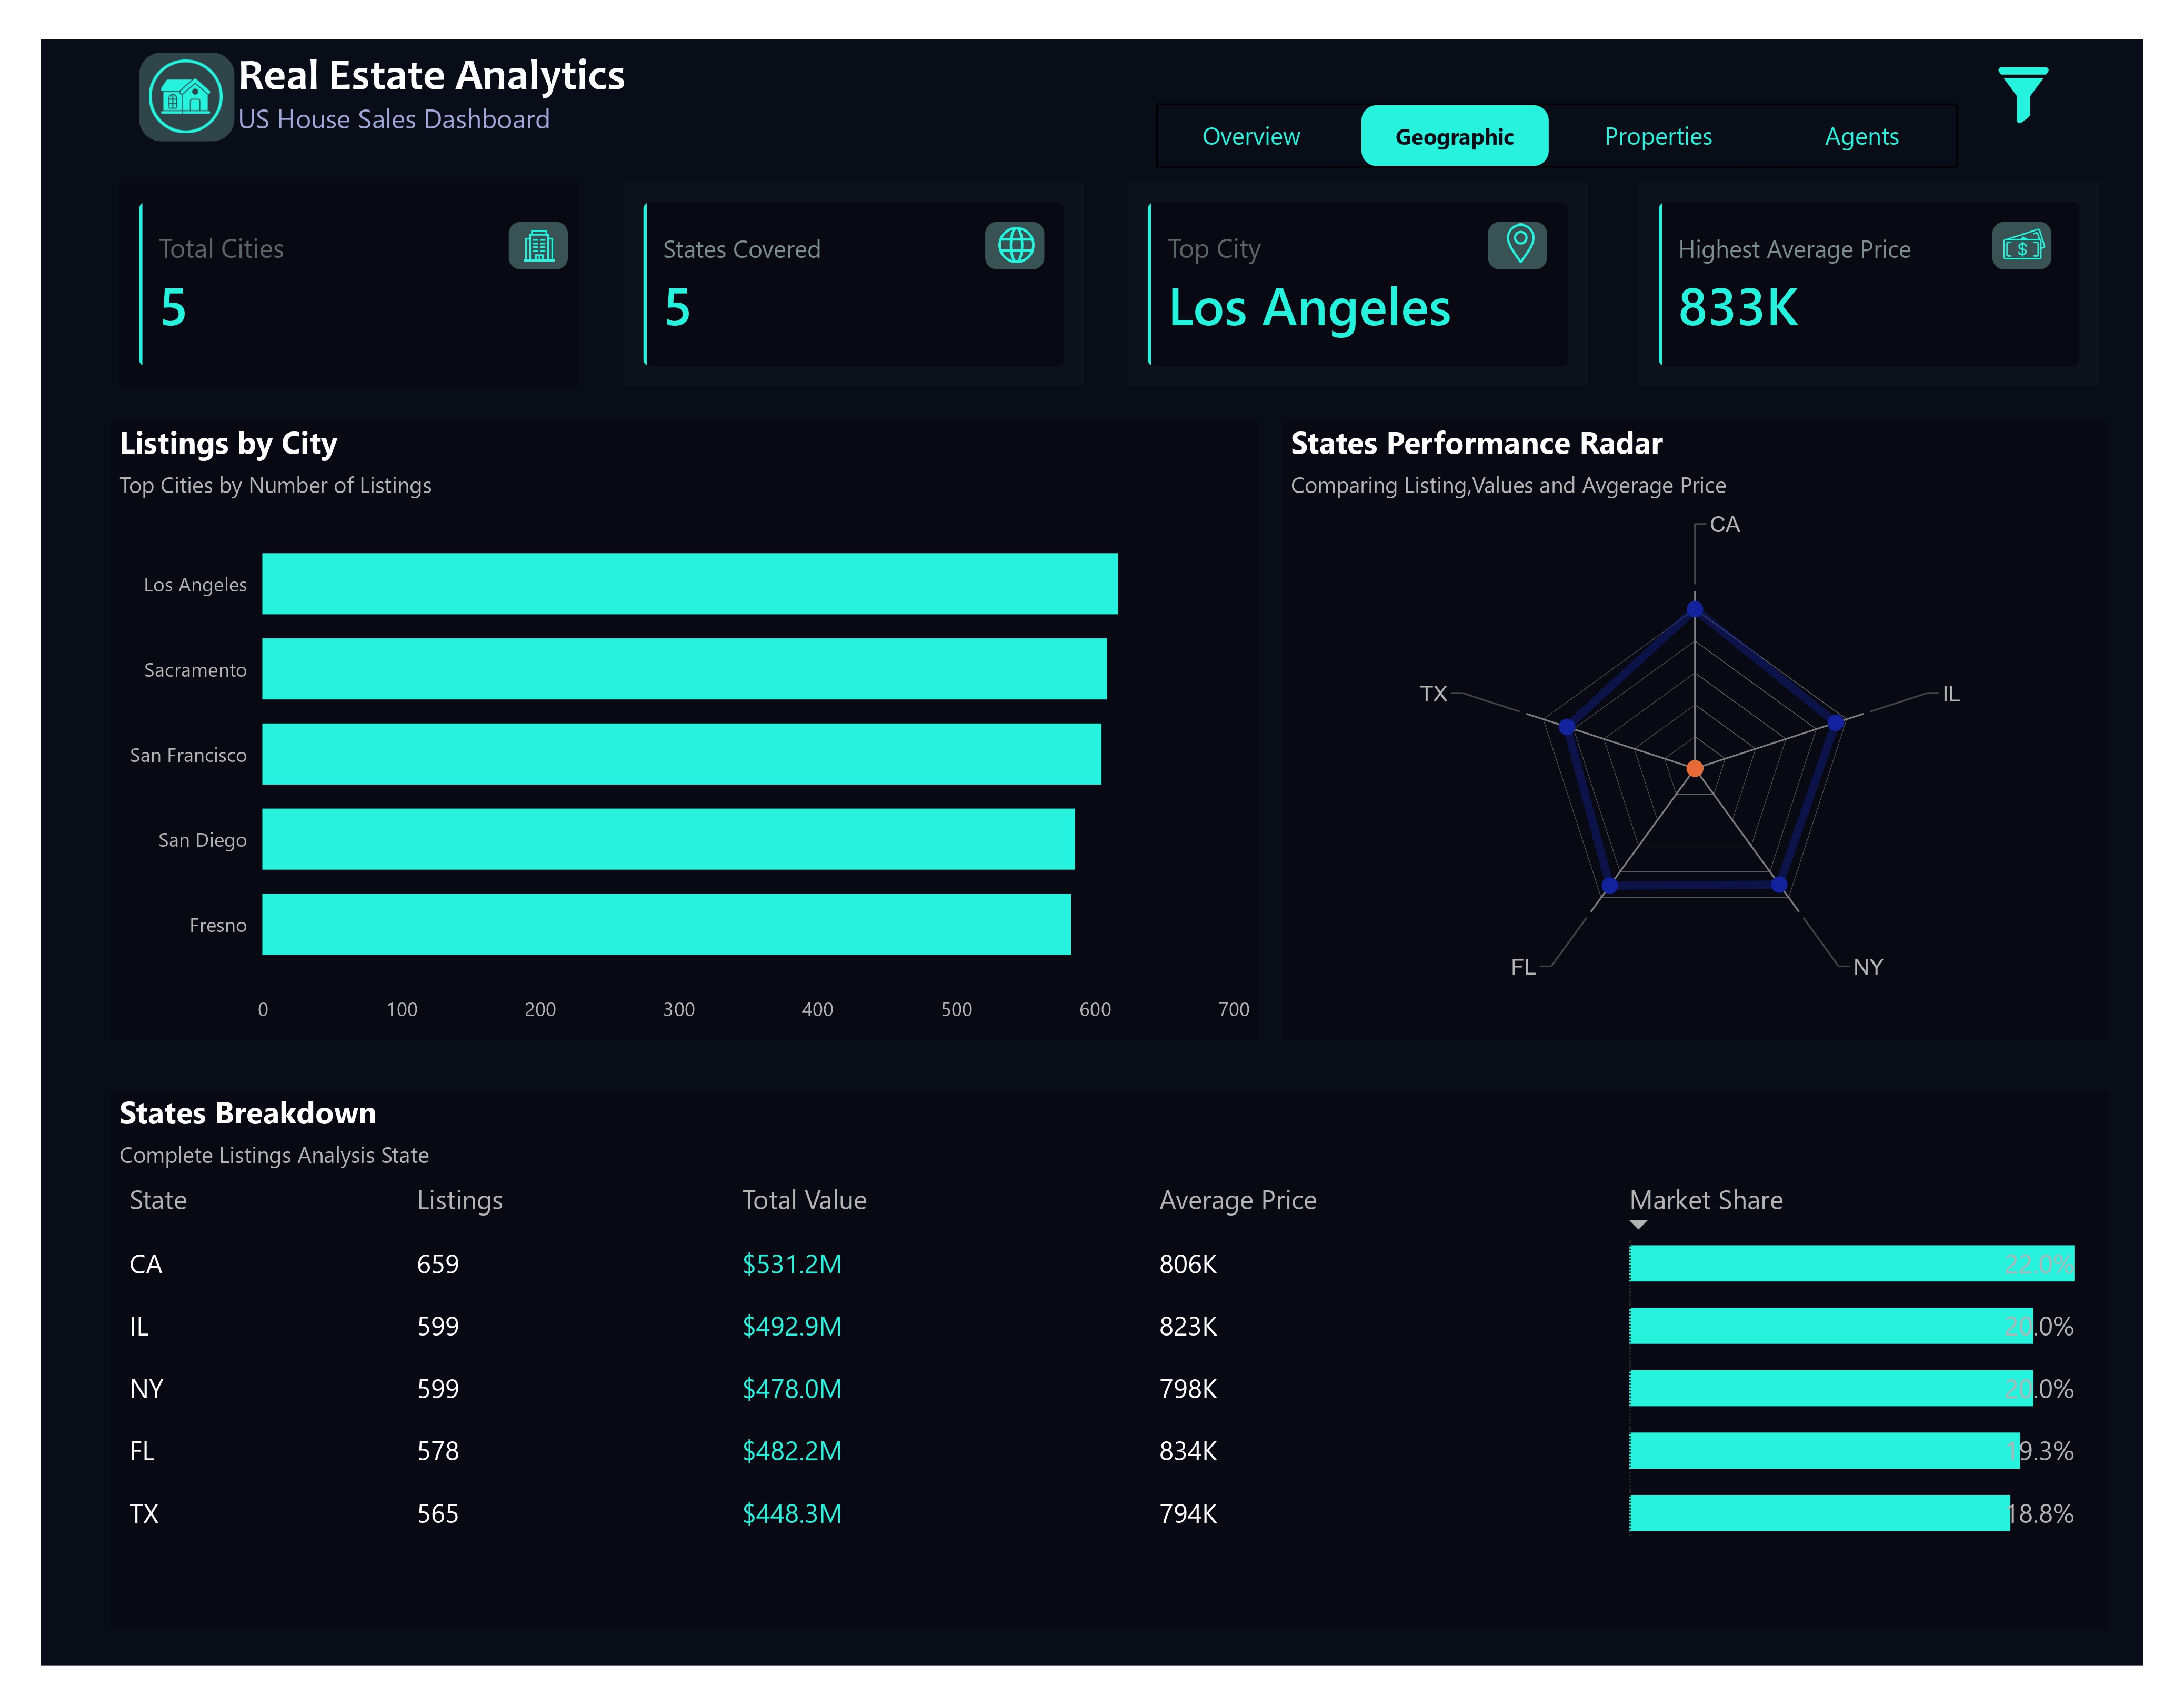
- Listings Are Concentrated in Major California Cities :
- Los Angeles leads in number of listings, making it the most active city.
- Sacramento, San Francisco, San Diego, and Fresno follow closely, showing California dominates geographic activity.
- This indicates strong urban demand and higher listing turnover in CA cities.
- Inights : The market is not evenly distributed — it’s city-driven, not state-wide uniform.
- California Has the Highest Market Value Share :
- Los Angeles :
- Highest listings (659)
- Highest total value ($531.2M)
- Strong average price ($806K)
- Despite Illinois and New York having similar listing counts, CA generates more total value, meaning higher-value properties.
- Insight : High-value properties, not just volume, drive California’s dominance.
- Florida Has the Highest Average Property Prices :
- Florida’s average price: $834K — the highest among all states.
- Yet Florida does not lead in listings or total value.
- Insight : Florida is a premium-priced but lower-volume market — fewer listings, higher price points.
- Illinois and New York Are Volume-Heavy but Mid-Priced :
- Both IL and NY have 599 listings each, showing strong activity.
- Average prices are lower than CA and FL.
- Total value slightly trails California.
- Insight : These states rely on transaction volume rather than premium pricing.
- Texas Is the Most Affordable Large Market :
- Lowest average price ($794K).
- Lowest market share (18.8%)
- Still maintains decent listing volume (565)
- Insight : Texas is positioned as a value-driven growth market, appealing to budget-conscious buyers.
- The Market Share Is Relatively Balanced Across States :
- Market shares range narrowly between 18.8% – 22%.
- No single state completely dominates listings.
- Insight : The portfolio is geographically diversified, reducing market risk.
Insights
- Double Down on California for Revenue Growth :
- Prioritize:
- High-end listings
- Luxury developments
- Faster sales cycles
- California offers the best balance of volume + value.
- Business move: Allocate more marketing and agent resources to CA cities.
- Position Florida as a Premium Market :
- Florida buyers tolerate higher prices.
- Ideal for :
- Luxury condos
- Investment properties
- Vacation homes
- Business move: Target high-income buyers and investors in Florida.
- Use Illinois & New York for High-Volume Transactions :
- These states are reliable for consistent sales.
- Best for:
- Mid-priced housing
- Faster turnover strategies
- Business move : Optimize pricing and listing speed rather than pushing premium prices.
- Expand Growth Strategy in Texas :
- Texas has affordability and room to scale.
- Potential for:
- First-time buyers
- Long-term appreciation
- Expansion of listings
- Business move : Increase listings and marketing to capture emerging demand.
- Optimize City-Level Strategy, Not Just State-Level :
- Los Angeles clearly outperforms other cities.
- Treat cities as micro-markets, not just state aggregates.
- Business move : City-focused pricing, promotions, and agent specialization.
Actionable Recommendation
Dashboard 3: Properties
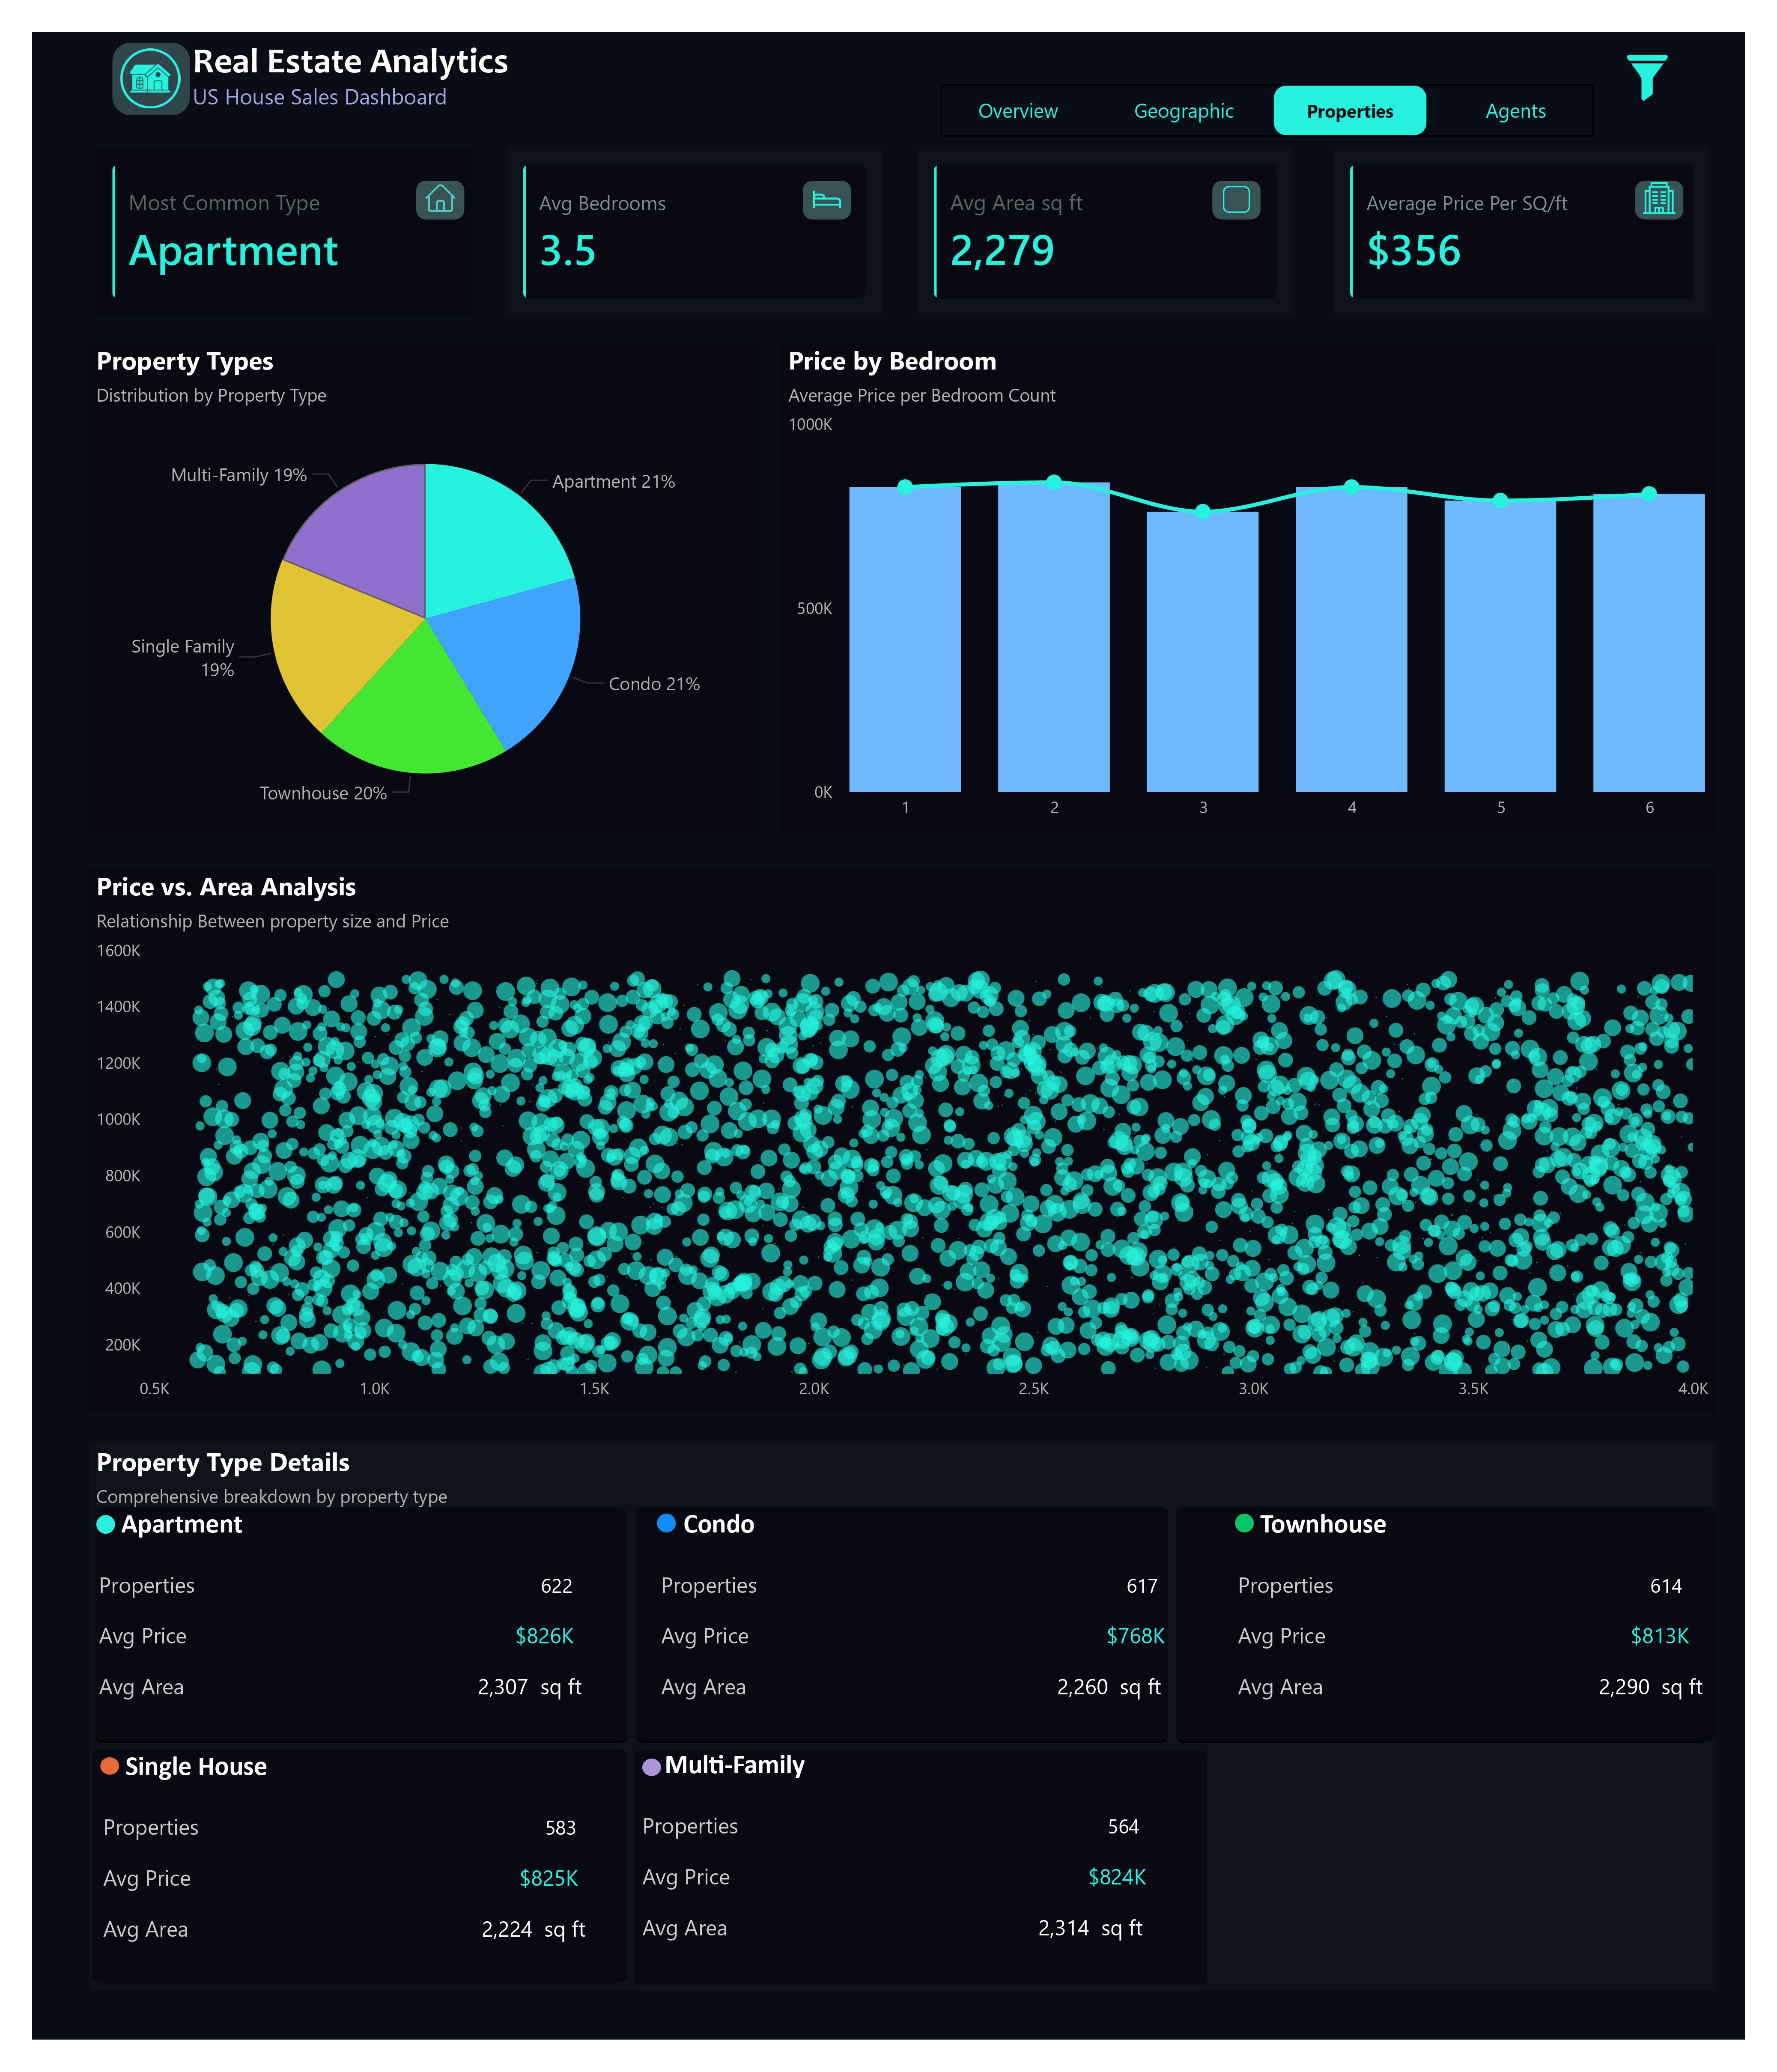
- Apartments Dominate the Market :
- Apartments are the most common property type
- They lead in :
- Number of listings (622)
- Highest average price ($826K)
- Largest average area (2,307 sq ft)
- Inights : Apartments are not “cheap urban units” here — they are high-value, spacious properties, likely in prime city locations.
- Property Type Distribution Is Well Balanced:
- Distribution is almost even :
- Apartments: 21%
- Condos: 21%
- Townhouses: 20%
- Single-family: 19%
- Multi-family: 19%
- Inights : The portfolio is diversified. No single property type dominates supply, which reduces exposure to market shocks.
- Bedroom Count Has Diminishing Returns After 4 Bedrooms :
- Prices increase from 1 → 2 bedrooms
- Drop at 3 bedrooms
- Slight recovery at 4 bedrooms
- Flat trend from 5–6 bedrooms
- Inights : Bigger does not always mean more expensive. Buyers are willing to pay premiums up to 4 bedrooms, but after that, price growth plateaus.
- Price per Sq Ft Is Relatively High ($356):
- Indicates :
- Strong demand
- Urban or high-value locations
- Efficient use of space
- Inights : The market values location and design, not just size.
- Weak Correlation Between Area and Price :
- Scatter plot shows wide price spread across all sizes.
- Large homes don’t always cost more.
- Smaller homes can still command premium prices.
- Flat trend from 5–6 bedrooms
- Inights : Pricing is driven more by location, property type, and features than square footage alone.
- Condos Are the Best “Value” Option:
- Condos:
- Avg price: $768K (lowest)
- Avg area: 2,260 sq ft
- Comparable size to apartments but cheaper.
- Inights :Condos offer better price-per-area value, attractive to budget-conscious buyers.
- Multi-Family Properties Are High-Value Investments :
- Avg price: $824K
- Large average area: 2,314 sq ft
- Lower count (564 listings)
- Inights : Multi-family properties are likely investor-driven — fewer listings, high capital value.
Insights
- Focus Sales & Marketing on Apartments :
- Apartments generate:
- Highest average prices
- Largest floor areas
- Strong buyer demand
- Business move: Prioritize premium apartment listings in marketing campaigns.
- Promote Condos as Affordable Alternatives :
- Similar size to apartments
- Lower price point
- Inights : Position condos as “best value per sq ft” for first-time buyers.
- Optimize Inventory Around 2–4 Bedrooms :
- Highest pricing efficiency
- Strong buyer preference
- Faster sales likelihood
- Inights : Avoid over-investing in 5–6 bedroom properties unless location justifies it.
- Use Price-per-Sq-Ft for Smarter Pricing :
- Area alone is misleading
- Use price per sq ft benchmarks instead of flat pricing
- Inights : Equip agents with price-per-sq-ft metrics during negotiations.
- Target Investors with Multi-Family Listings :
- High price
- Large area
- Scarcity increases appeal
- Inights : Market multi-family homes as long-term income assets.
- City + Property Type Segmentation :
- Since size ≠ price, combine:
- City
- Property type
- Bedroom count
- Inights : Use micro-segmentation to improve pricing accuracy and reduce time on market.
Actionable Recommendation
Dashboard 4: Agents
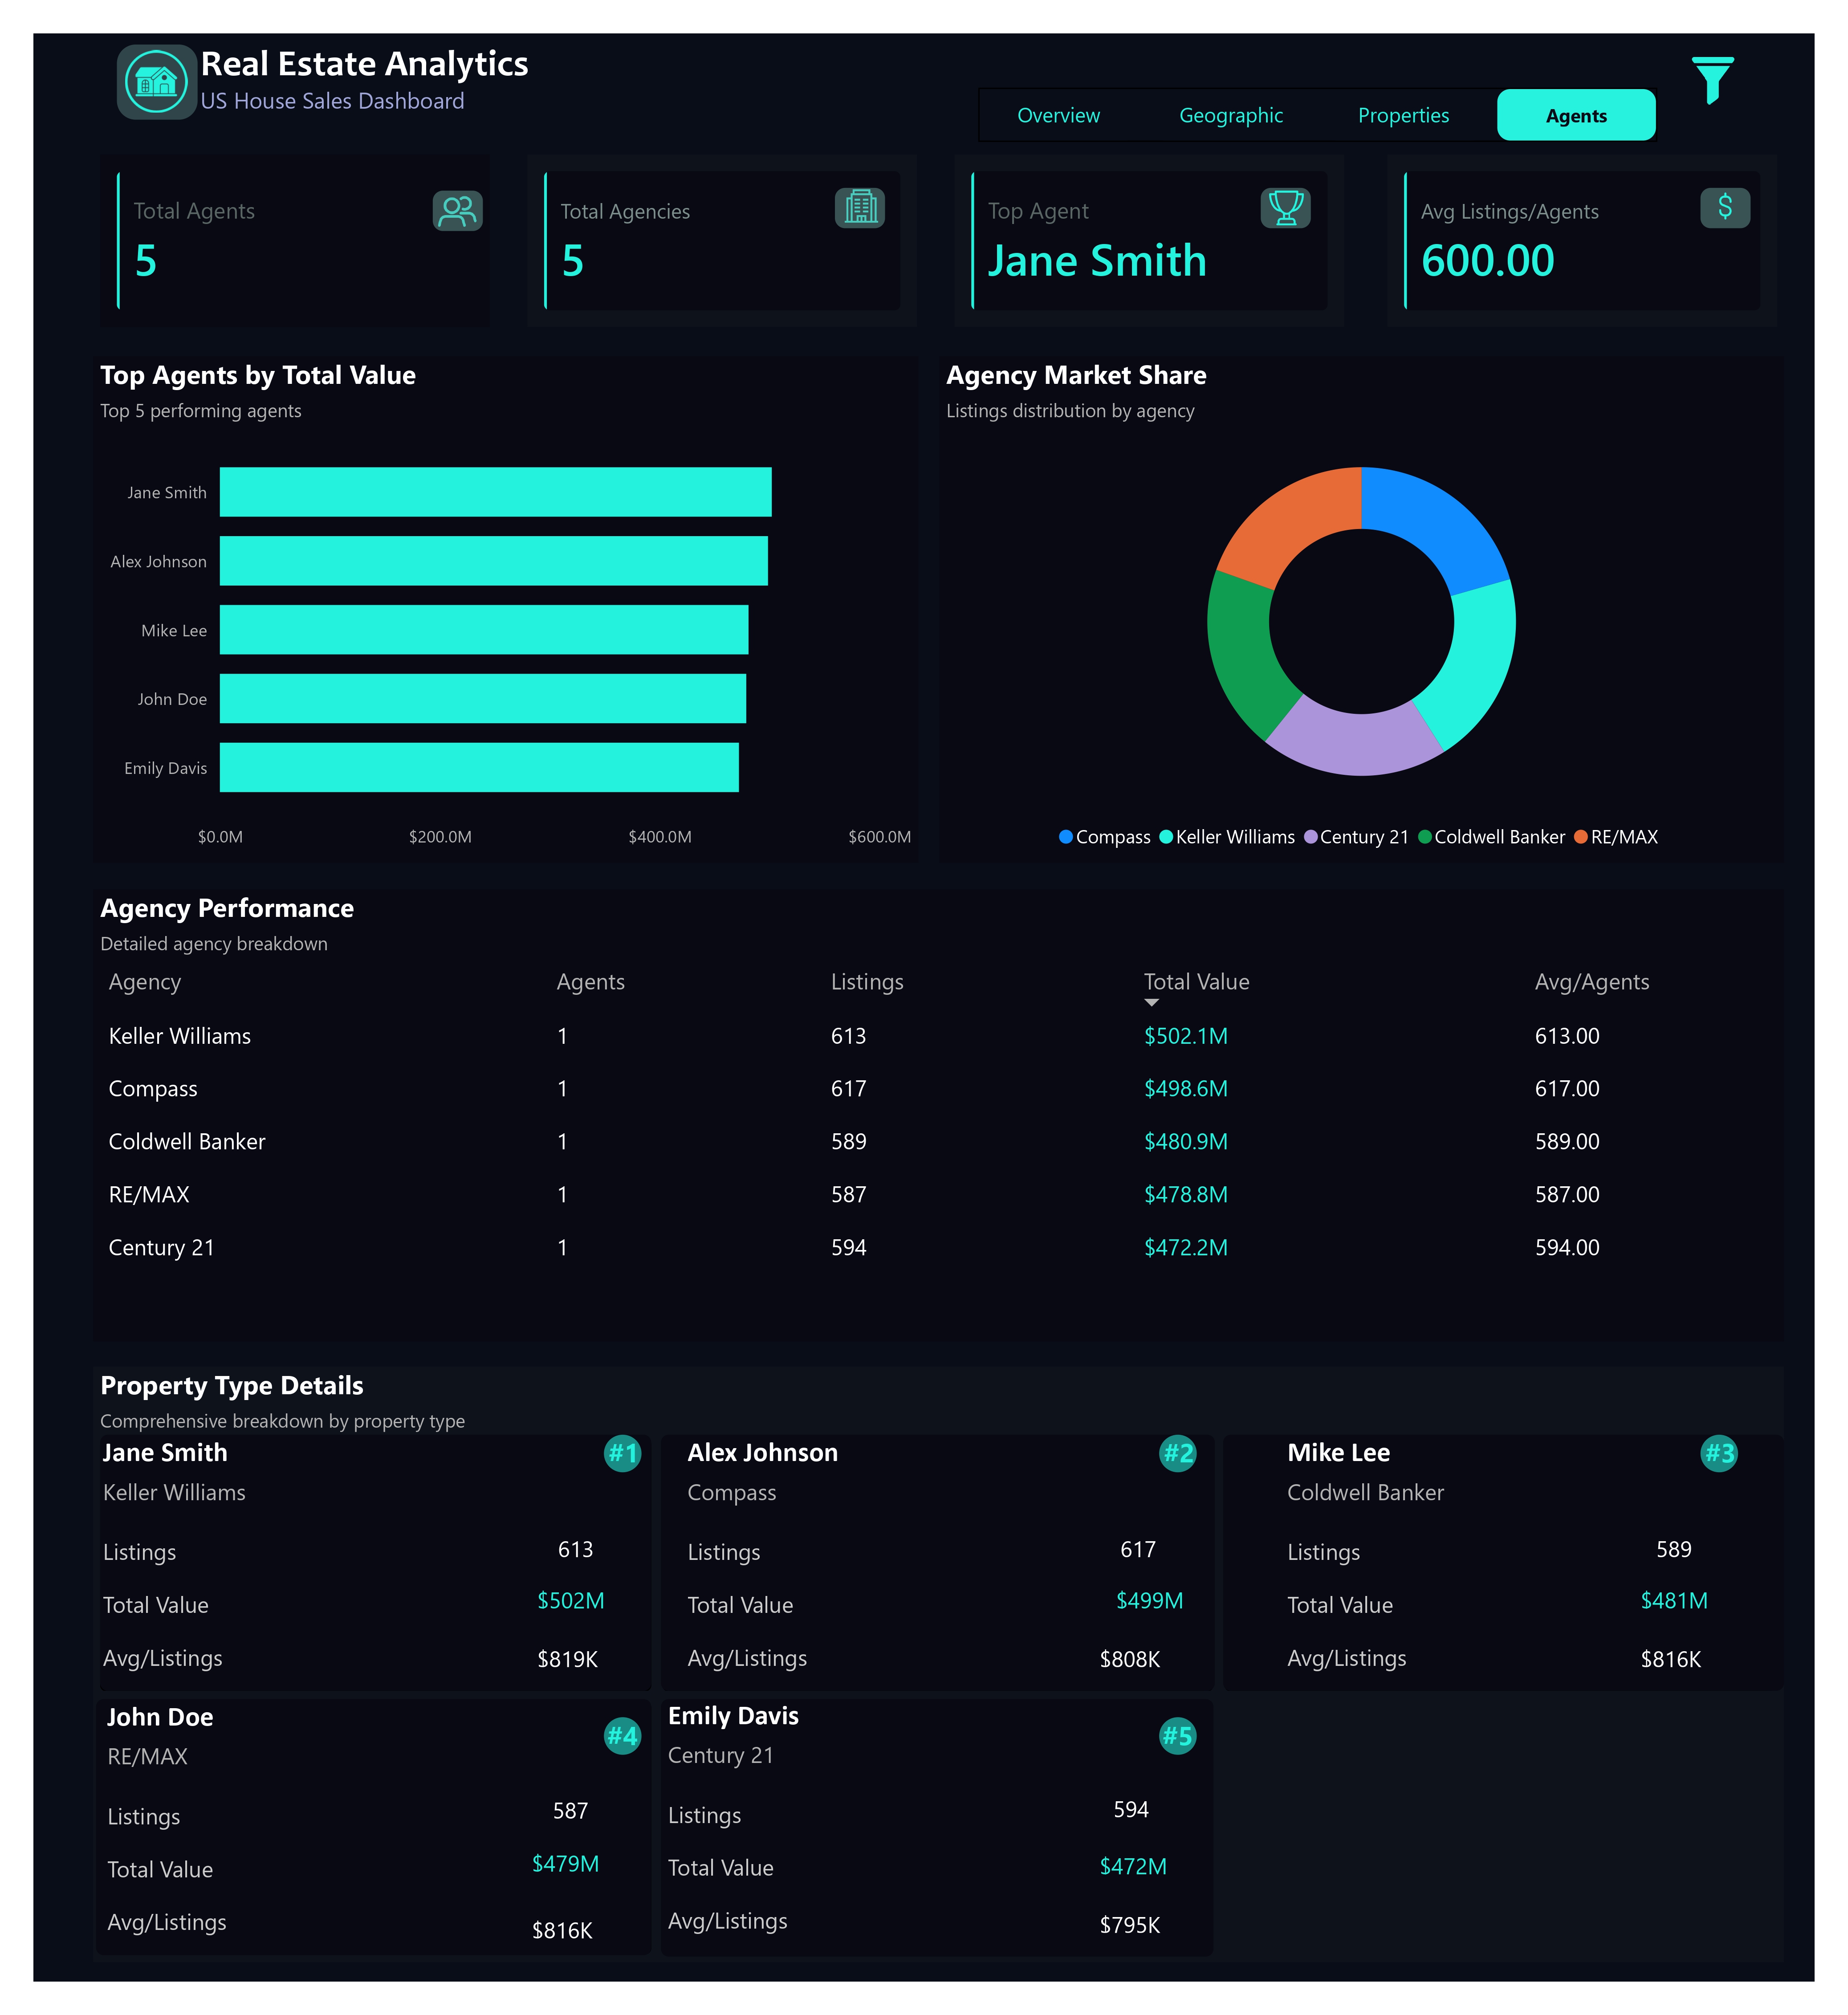
- Performance Is Highly Concentrated at the Top :
- Jane Smith is the top-performing agent:
- Total Value: $502.1M
- Listings: 613
- Avg value per listing: $819K
- The gap between agents is small, but ranking is driven by value, not volume alone.
- Business move: Small differences in deal value create big differences in total revenue.
- All Agents Carry Heavy Workloads :
- Avg Listings per Agent: 600
- Each agent manages a similar number of listings.
- Inights : Productivity differences come from pricing and deal quality, not effort or workload.
- Agencies Are Perfectly Balanced :
- Each agency:
- Has 1 agent
- Controls 20% market share
- No agency dominance.
- Business move: The market is highly competitive and evenly distributed, reducing dependency risk on a single brokerage.
- Keller Williams Leads in Total Value:
- Keller Williams:
- Highest agency total value $502.1M
- Strong listing efficiency
- Business move: Brand + agent quality combination matters more than sheer listing count.
- Compass Has the Highest Listing Volume:
- Compass agent:
- Highest listings 617
- Second-highest total value $498.6M
- Business move: Compass prioritizes volume-driven growth, while Keller Williams edges ahead in value optimization.
- Bottom-Ranked Agents Are Still High Performers :
- Even #5 (Emily Davis):
- Total Value: $472M
- Nearly identical listing volume
- Business move: This is a high-performing, low-variance agent pool, ideal for scaling.
Insights
- Replicate Top-Agent Playbooks :
- Study:
- Jane Smith’s pricing strategy
- Property type focus
- Geographic targeting
- Business move: Small differences in deal value create big differences in total revenue.
- Shift KPIs from Volume to Value :
- Listings alone don’t tell the story.
- Value per listing is the growth lever.
- Inights :Incentivize agents based on total value closed, not just deal count.
- Upskill Lower-Ranked Agents in Pricing Strategy:
- Emily Davis has comparable volume but lower avg value.
- Inights :Provide pricing and negotiation coaching to lift deal quality.
- Strengthen High-Value Inventory Access :
- High performers likely access better listings.
- Inights :Ensure premium inventory is distributed strategically, not randomly.
- Use Agency Balance as a Growth Advantage:
- Equal market share = negotiation power.
- Inights :Use competition to drive innovation, performance bonuses, and internal benchmarking.
- Predict Revenue Using Agent Metrics:
- Stable listing counts + avg value = strong forecasting model.
- Action: Build predictive KPIs using:
- Avg value per listing
- Listings per agent
- Close rate (future enhancement)
Actionable Recommendation
NEXT STEP — Implementation Roadmap
To build on the findings from all three dashboards, the next phase of this project should focus on Operational Execution, Predictive Modeling, and Continuous Monitoring:
1️. Implement Data-Driven Interventions
Use the insights from the dashboards to design targeted action plans:
- Reduce peak waiting times by introducing triage streamlining and hourly resource allocation.
- Address readmission drivers through improved discharge planning and chronic-care follow-up protocols.
- Resolve administrative bottlenecks by redesigning discharge workflows and clarifying staff responsibilities.
These interventions should be piloted in the departments identified as the highest risk (Emergency, Pulmonology, Orthopedics, Cardiology).
2️. Build a Predictive Readmission Risk Model
Using the readmission dataset, develop a machine-learning model to:
- Predict which patients are likely to be readmitted.
- Flag high-risk diagnoses (e.g., heart failure, COPD).
- Provide early alerts to clinicians to intervene before readmission happens.
Modeling tools expected: SQL for feature extraction, Python for modeling, Power BI for deployment dashboards.
3️. Create a Real-Time Monitoring System
Integrate the dashboards into a real-time reporting cycle so leadership can:
- Track bed utilization hour-by-hour.
- View discharge delays daily.
- Monitor readmission KPIs weekly.
This can be deployed using:
• Power BI Service (auto-refresh dashboard)
• SQL Server scheduled refresh
• Optional Supabase triggers (if building internally)
4️. Conduct a Root-Cause Analysis Workshop
Bring clinical teams, operations managers, and administrators together to:
- Validate dashboard findings.
- Identify workflow inefficiencies not visible in the data.
- Co-design solutions with the people who handle these issues daily.
This guarantees your recommendations lead to actual behavior change.
5️. Build Version 2.0 of the Dashboard Suite
Enhance the dashboards with:
- Department-level drill-downs
- Predictive KPIs (not just descriptive)
- Benchmarking against previous years or similar hospitals
- Automated alerts for:
- • High wait time spikes
- • Low staff-to-bed ratios
- • High readmission days
This turns your dashboards into a fully decision-support tool, not just a reporting tool.
6️. Present a 90-Day Improvement Plan
Summarize everything into one operational roadmap:
- 30 days: Implement workflow changes + automate data refresh
- 60 days: Launch predictive modeling + department training
- 90 days: Release Dashboard Suite 2.0 + measure impact