YouTube Videos Performance Analysis | Case Study
_________________________________________________________________________________________________________________________________________Project Overview
This project involved a complete end-to-end pipeline, starting from raw data ingestion and cleaning, through data modeling and advanced DAX measure creation, culminating in two interconnected Power BI dashboards for strategic growth analysis.Business Challenge
The client possessed raw, unstructured video data containing aggregated metrics (views, likes, shares). The data was initially messy and required validation before any meaningful analysis or optimization could occur. Key challenges included:- Data Quality Issues: Initial source data required validation, type casting, and handling of inconsistencies.
- Lack of Time-Series Analysis: Data was not connected to a date dimension, preventing Year-over-Year (YoY) comparisons.
- Data Aggregation: Difficulty in comparing metrics against dimension attributes (e.g., category, upload hour) due to unoptimized flat tables.
Business Goal
The primary objective was to establish a robust Star Schema foundation, preceded by thorough data preparation, to enable deep-dive analysis and create two high-impact, actionable dashboards.Methodology
The project followed a structured data pipeline approach, ensuring data quality and model optimization at every stage.- Data Ingestion & Cleaning:
Conducted initial cleansing, handling missing values, standardizing column names, and ensuring correct data types. - Exploratory Data Analysis:
Performed aggregation queries, calculated high-level summary statistics, and identified potential outliers and distribution patterns. - Data Modeling:
Established a Star Schema with fact and dimension tables, created relationships, and developed more than 15 advanced DAX measures for dynamic insights. - Dashboard Development:
Designed two interactive Power BI dashboards:- Performance Overview
- Content Strategy
Technology Used
- Python: Data Ingestion & Cleaning
- SQL: Exploratory data analysis to identify trends and patterns.
- Power BI: Data modeling, DAX measure creation, and dashboard visualization.
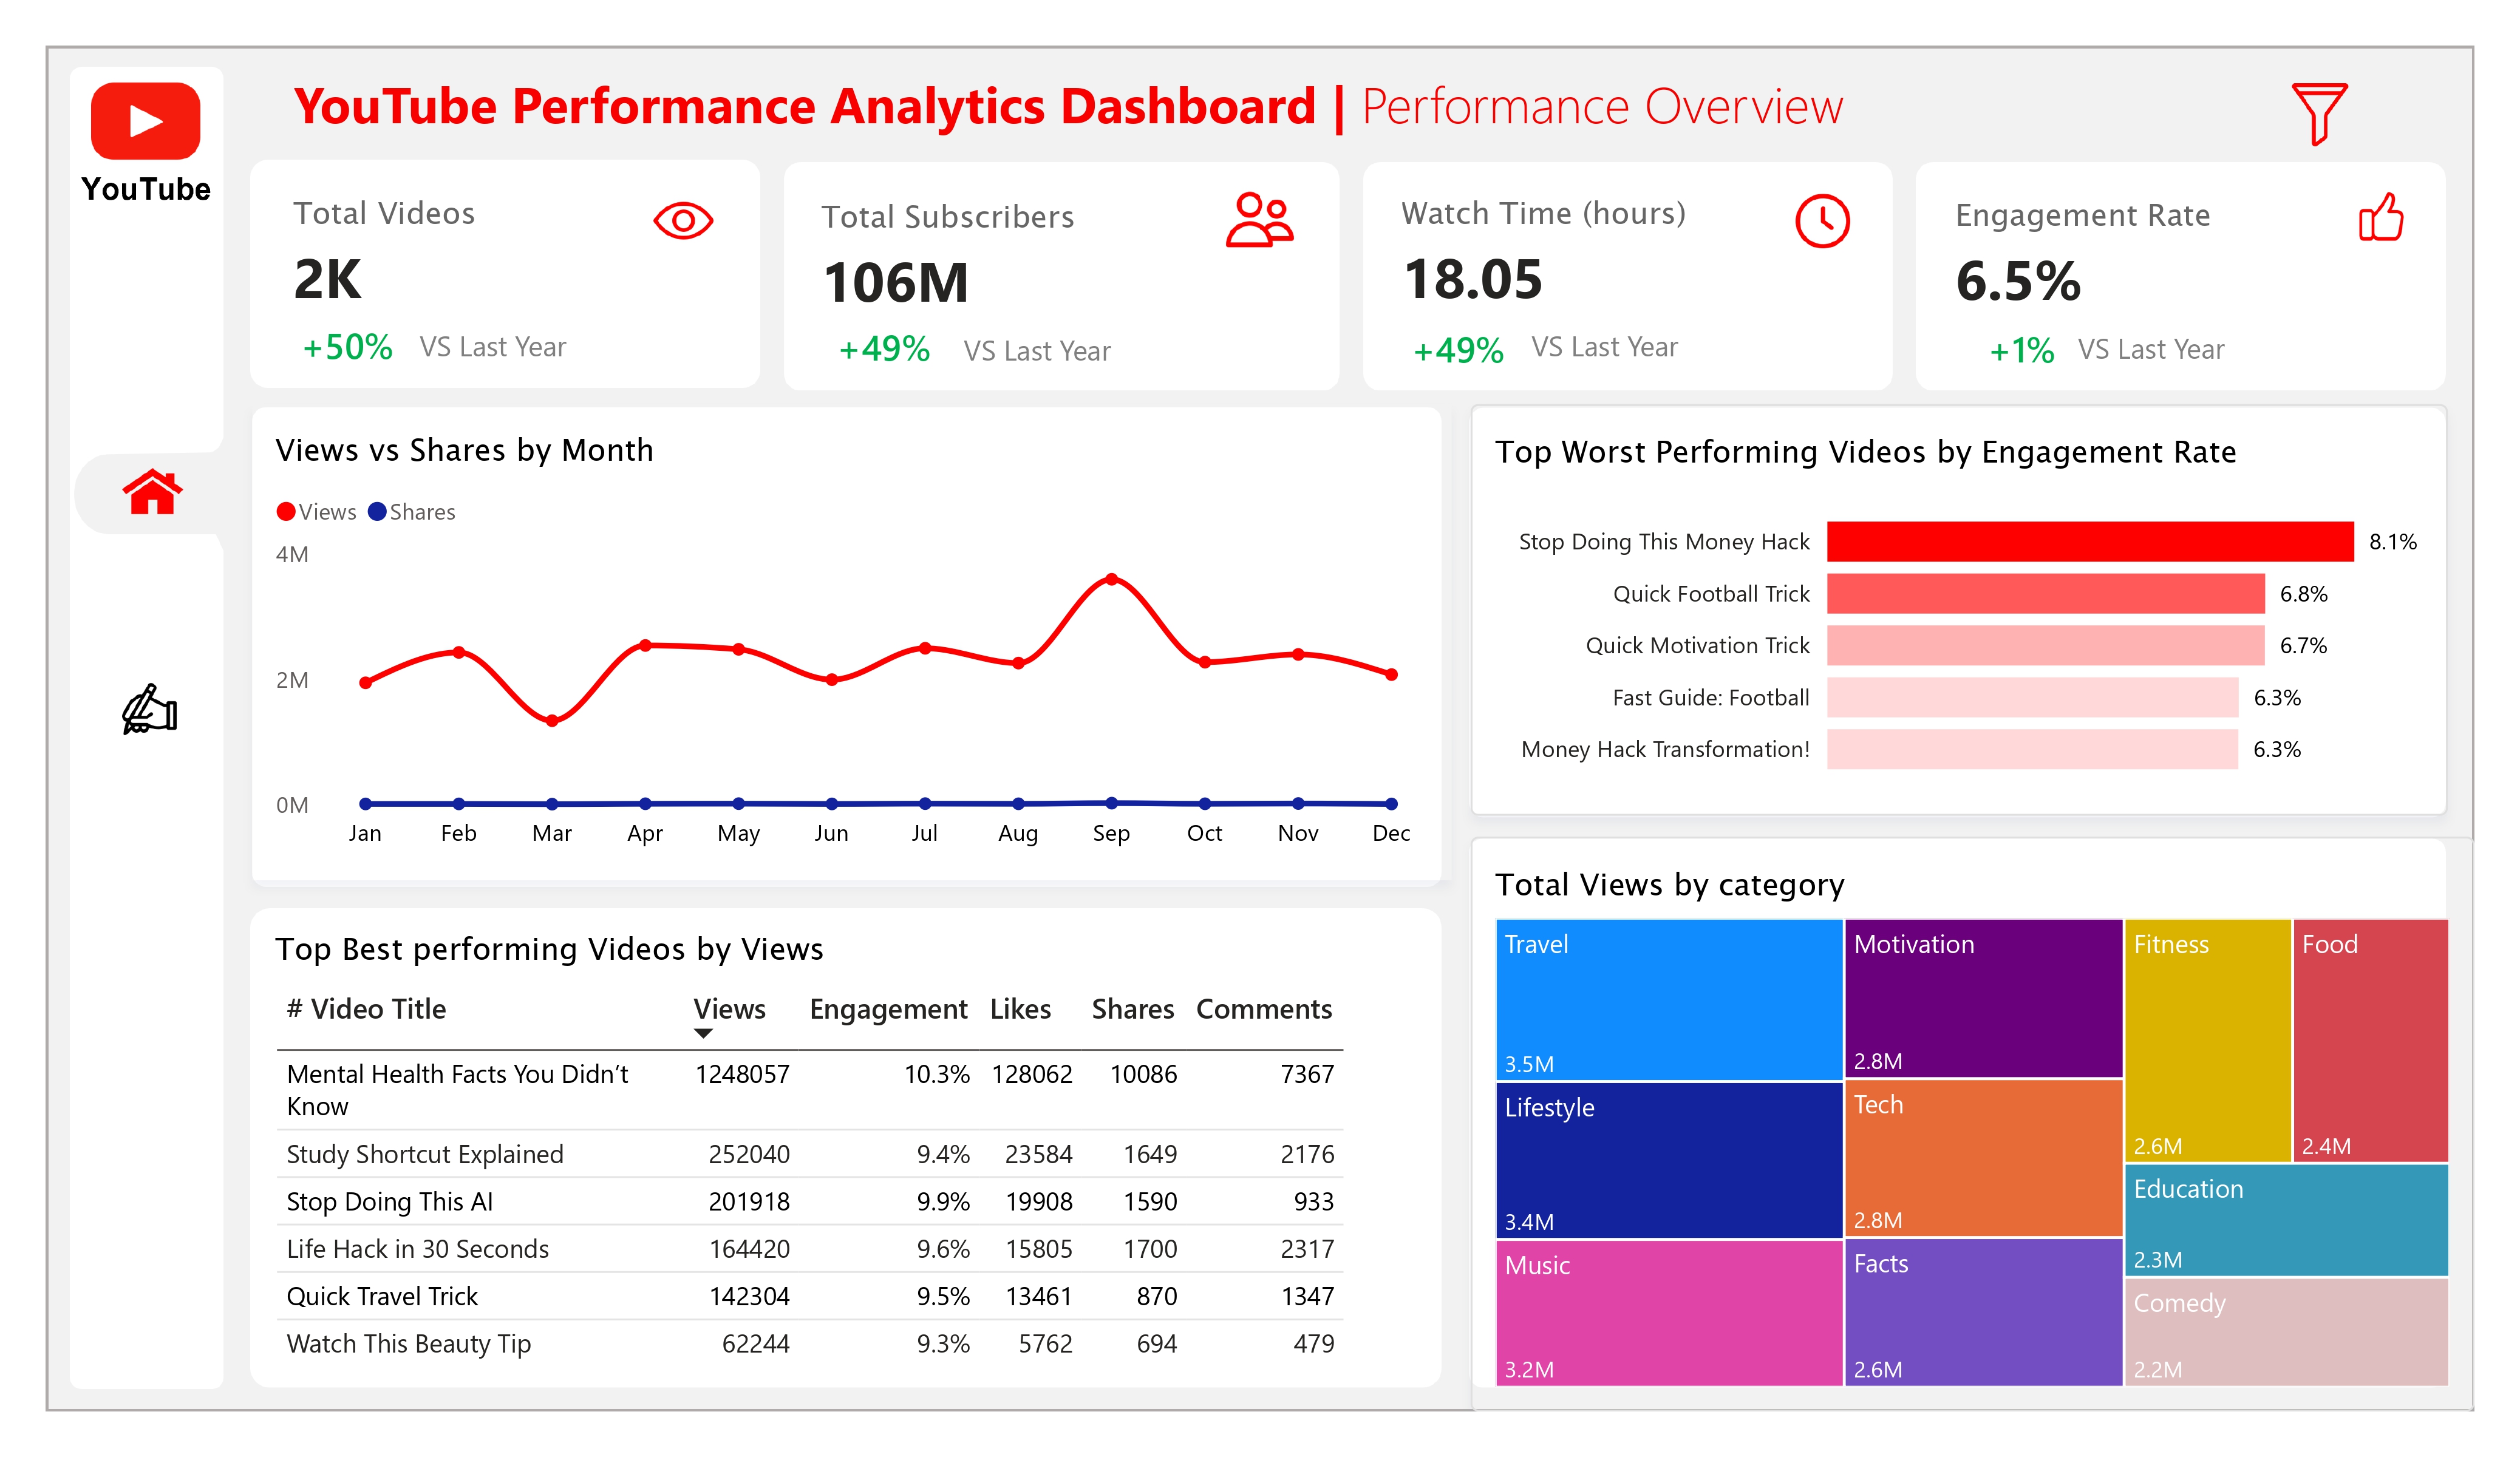
_________________________________________________________________________________________________________________________________________Dashboard 1: Performance Overview
Key Insights
- Positive Content Quality: The Engagement Rate KPI showing an increase (e.g., +15% YoY) validates that the recent content quality or audience targeting strategies are working effectively.
- Strong Vertical Dominance: The Category Distribution visual reveals a high dependency on a single content vertical (e.g., "Food" driving 40% of all views). This vertical is critical but also exposes the channel to risk if that trend shifts.
- Seasonal Volatility: The Total Views Trend chart identifies predictable low-view periods (e.g., a dip every July), likely due to audience seasonality or external factors.
- Wasted Reach: The Worst Performing Videos table highlights content that achieved high visibility but failed to generate engagement, suggesting poor topic choice or execution for those specific titles.
Recommendations
- Budget Allocation:Allocate 50% of the next production budget to the top two performing categories to capitalize on proven audience interest and maximize immediate reach.
- Mitigate Seasonal Risk: Increase promotional spend or experiment with "evergreen" content releases during identified low-view months (e.g., July) to smooth out the trend curve.
- Content Hygiene: Review and recommend deprecating (hiding) the worst-performing videos to prevent them from negatively impacting the channel’s average engagement metrics and overall health score in recommendation algorithms.
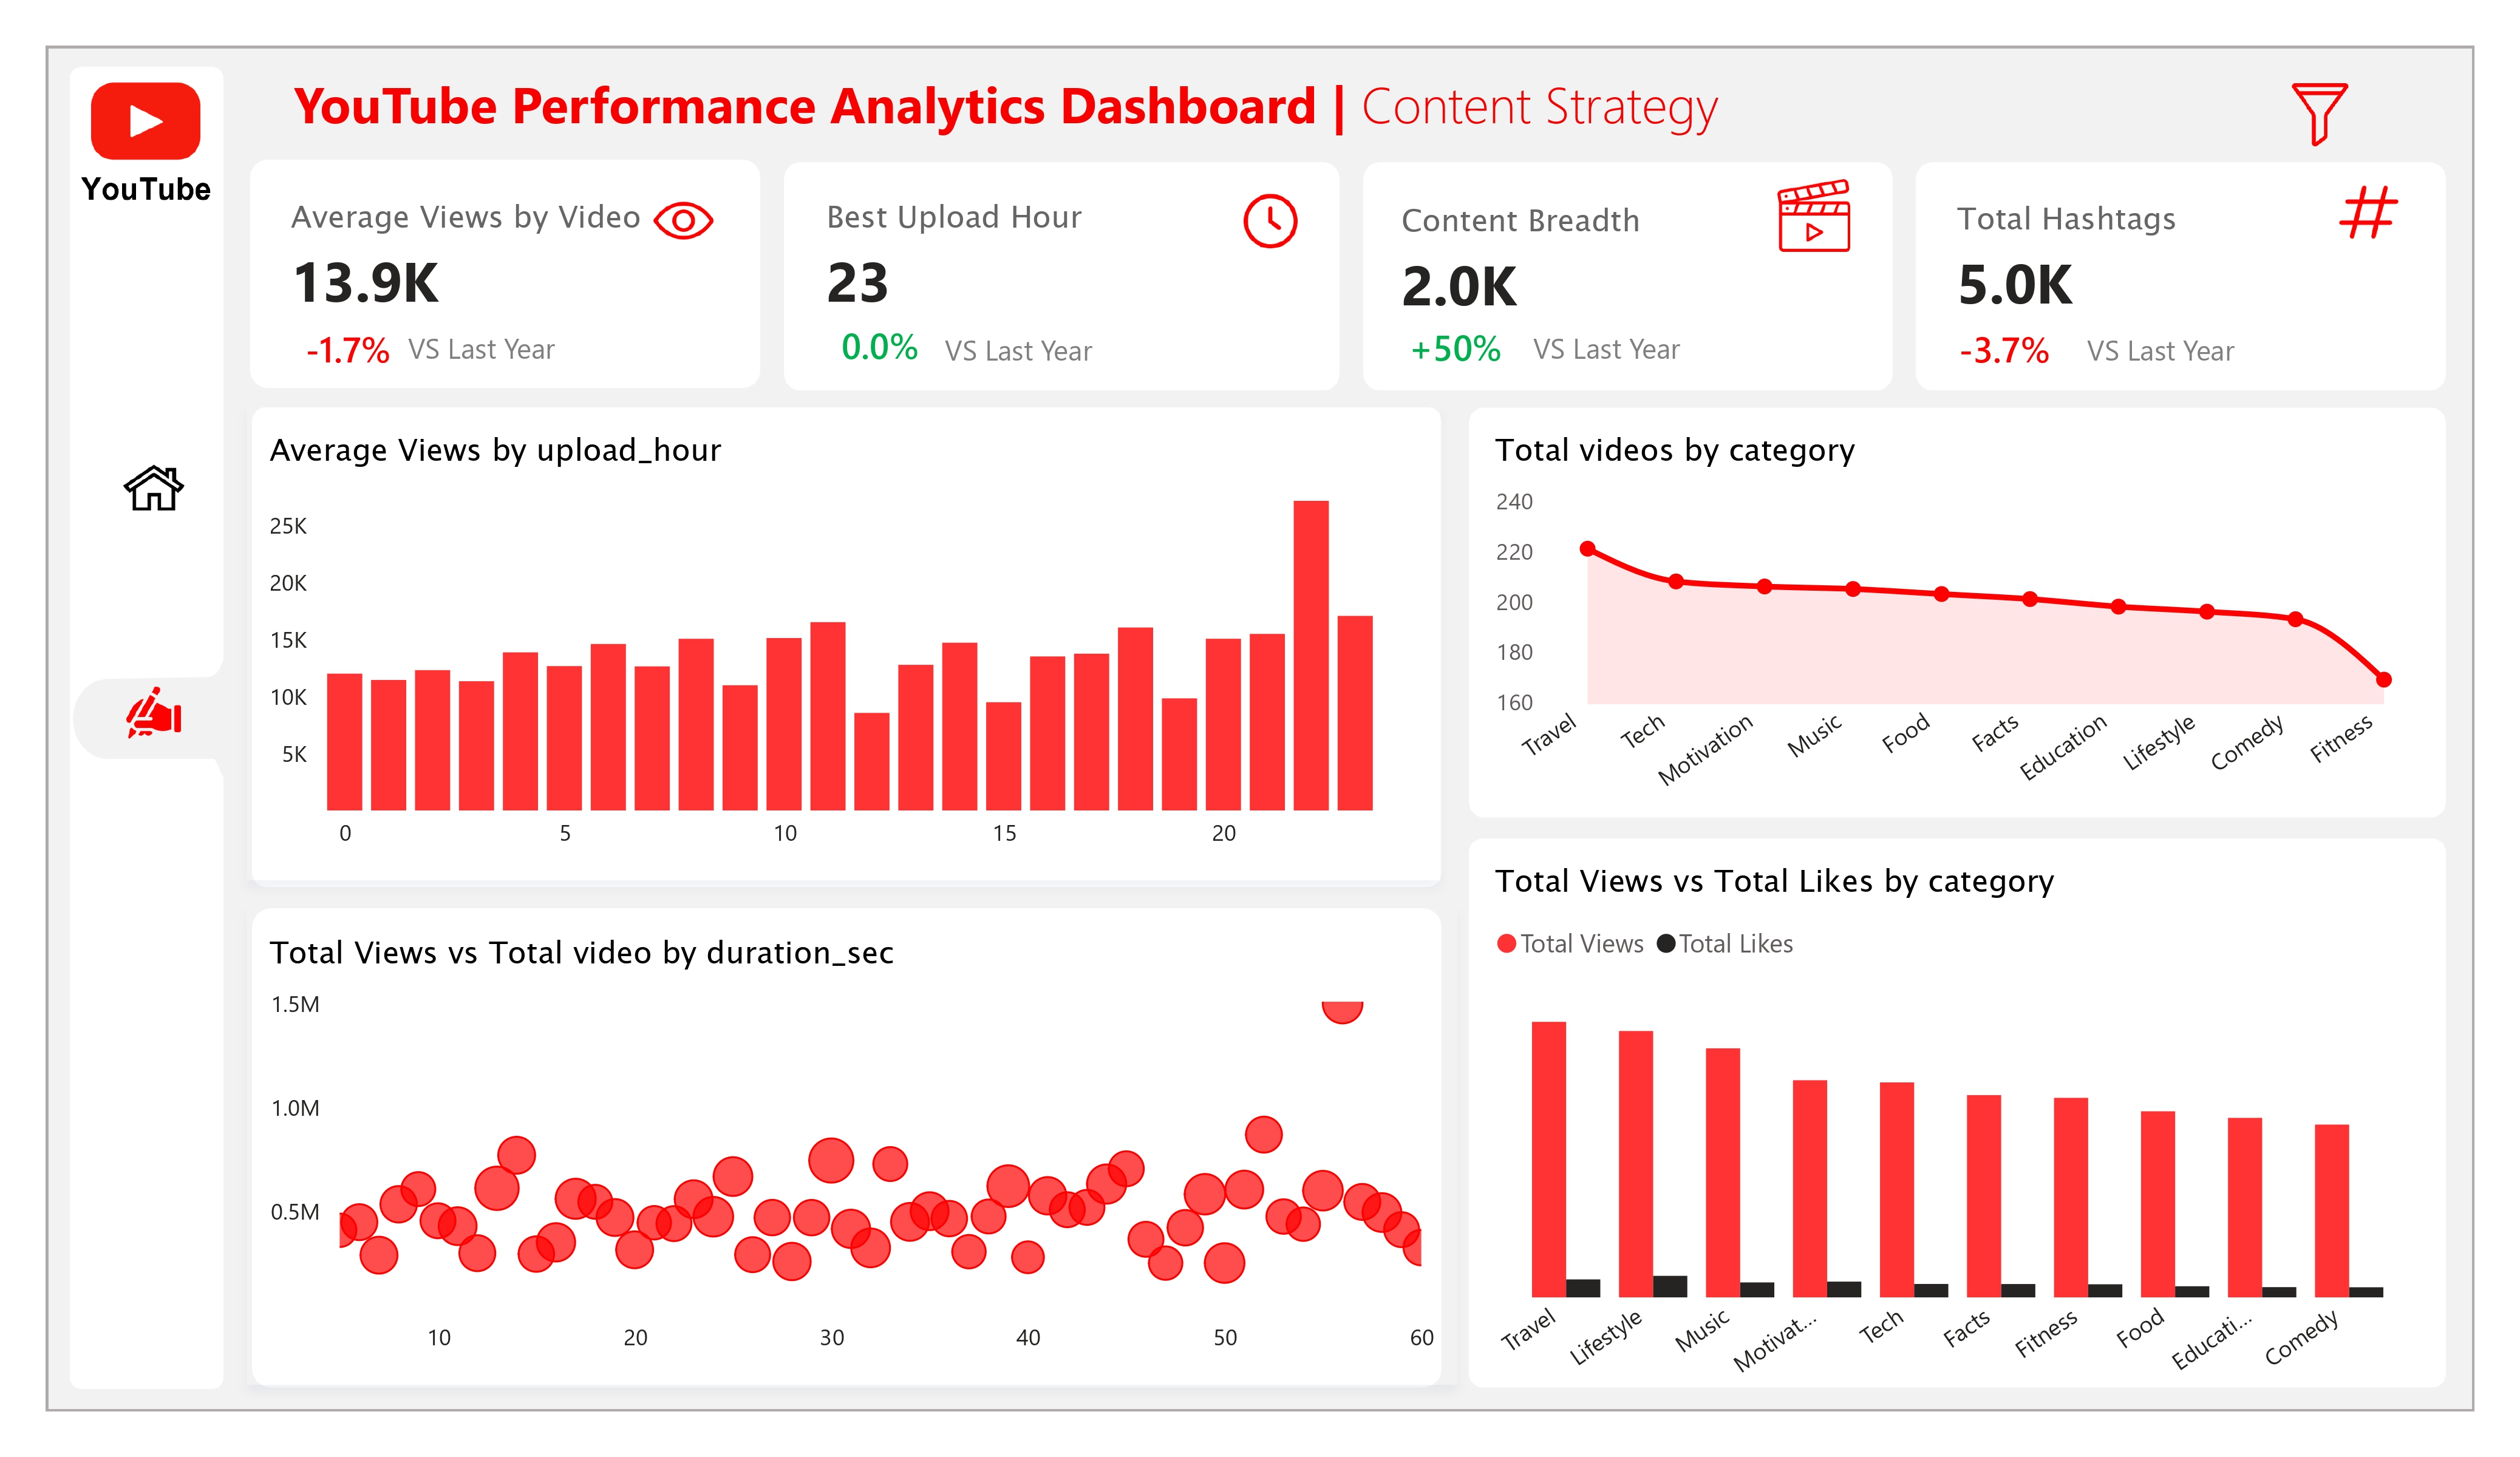
_________________________________________________________________________________________________________________________________________Dashboard 2: Content Strategy
Key Insights
- Optimal Posting Time is Clear: The Average Views by Upload Hour chart definitively proves that videos posted at a specific time (e.g., 19:00 EAT) generate significantly higher average views (e.g., +25% higher).
- Duration Sweet Spot Identified: The Views vs. Duration Scatter Plot shows a strong cluster of high-view videos within a narrow duration band (e.g., 15-22 seconds), confirming a specific length resonates best with the audience.
- Inefficient Hashtag Use: The Hashtag Efficiency KPI shows a negative change (e.g., -8% YoY), indicating that increasing the volume of hashtags is not translating into better view-to-hashtag performance.
- Engagement Conversion Gap: The Category Breakdown reveals certain content types have high views but disproportionately low likes, indicating a gap between initial interest and viewer action.
Recommendations
- Enforce Publishing Schedule: Implement a mandatory and strict publishing schedule to align all new content releases with the identified peak-performing hour (e.g., 19:00 EAT) to maximize initial reach.
- Mandate Duration Limits: Limit all new video production to the optimal duration range (e.g., 15-22 seconds). This is a high-confidence recommendation to improve average video performance immediately.
- A/B Test Hashtags: Conduct a focused A/B test to reduce the average number of hashtags per video to see if focusing on fewer, more relevant tags improves the overall efficiency score.
- Optimize Call-to-Action (CTA): Review video endings for all low-engagement categories to ensure they contain clear, visually strong calls-to-action requesting likes and comments.
_________________________________________________________________________________________________________________________________________NEXT STEP
The next phase of this project would focus on enhancing the predictive power of the model:- Integrate machine learning algorithms to predict video performance based on content attributes.
- Automate data refreshes to ensure dashboards reflect the latest trends and metrics.
- Expand the dataset to include competitor analysis for benchmarking purposes.